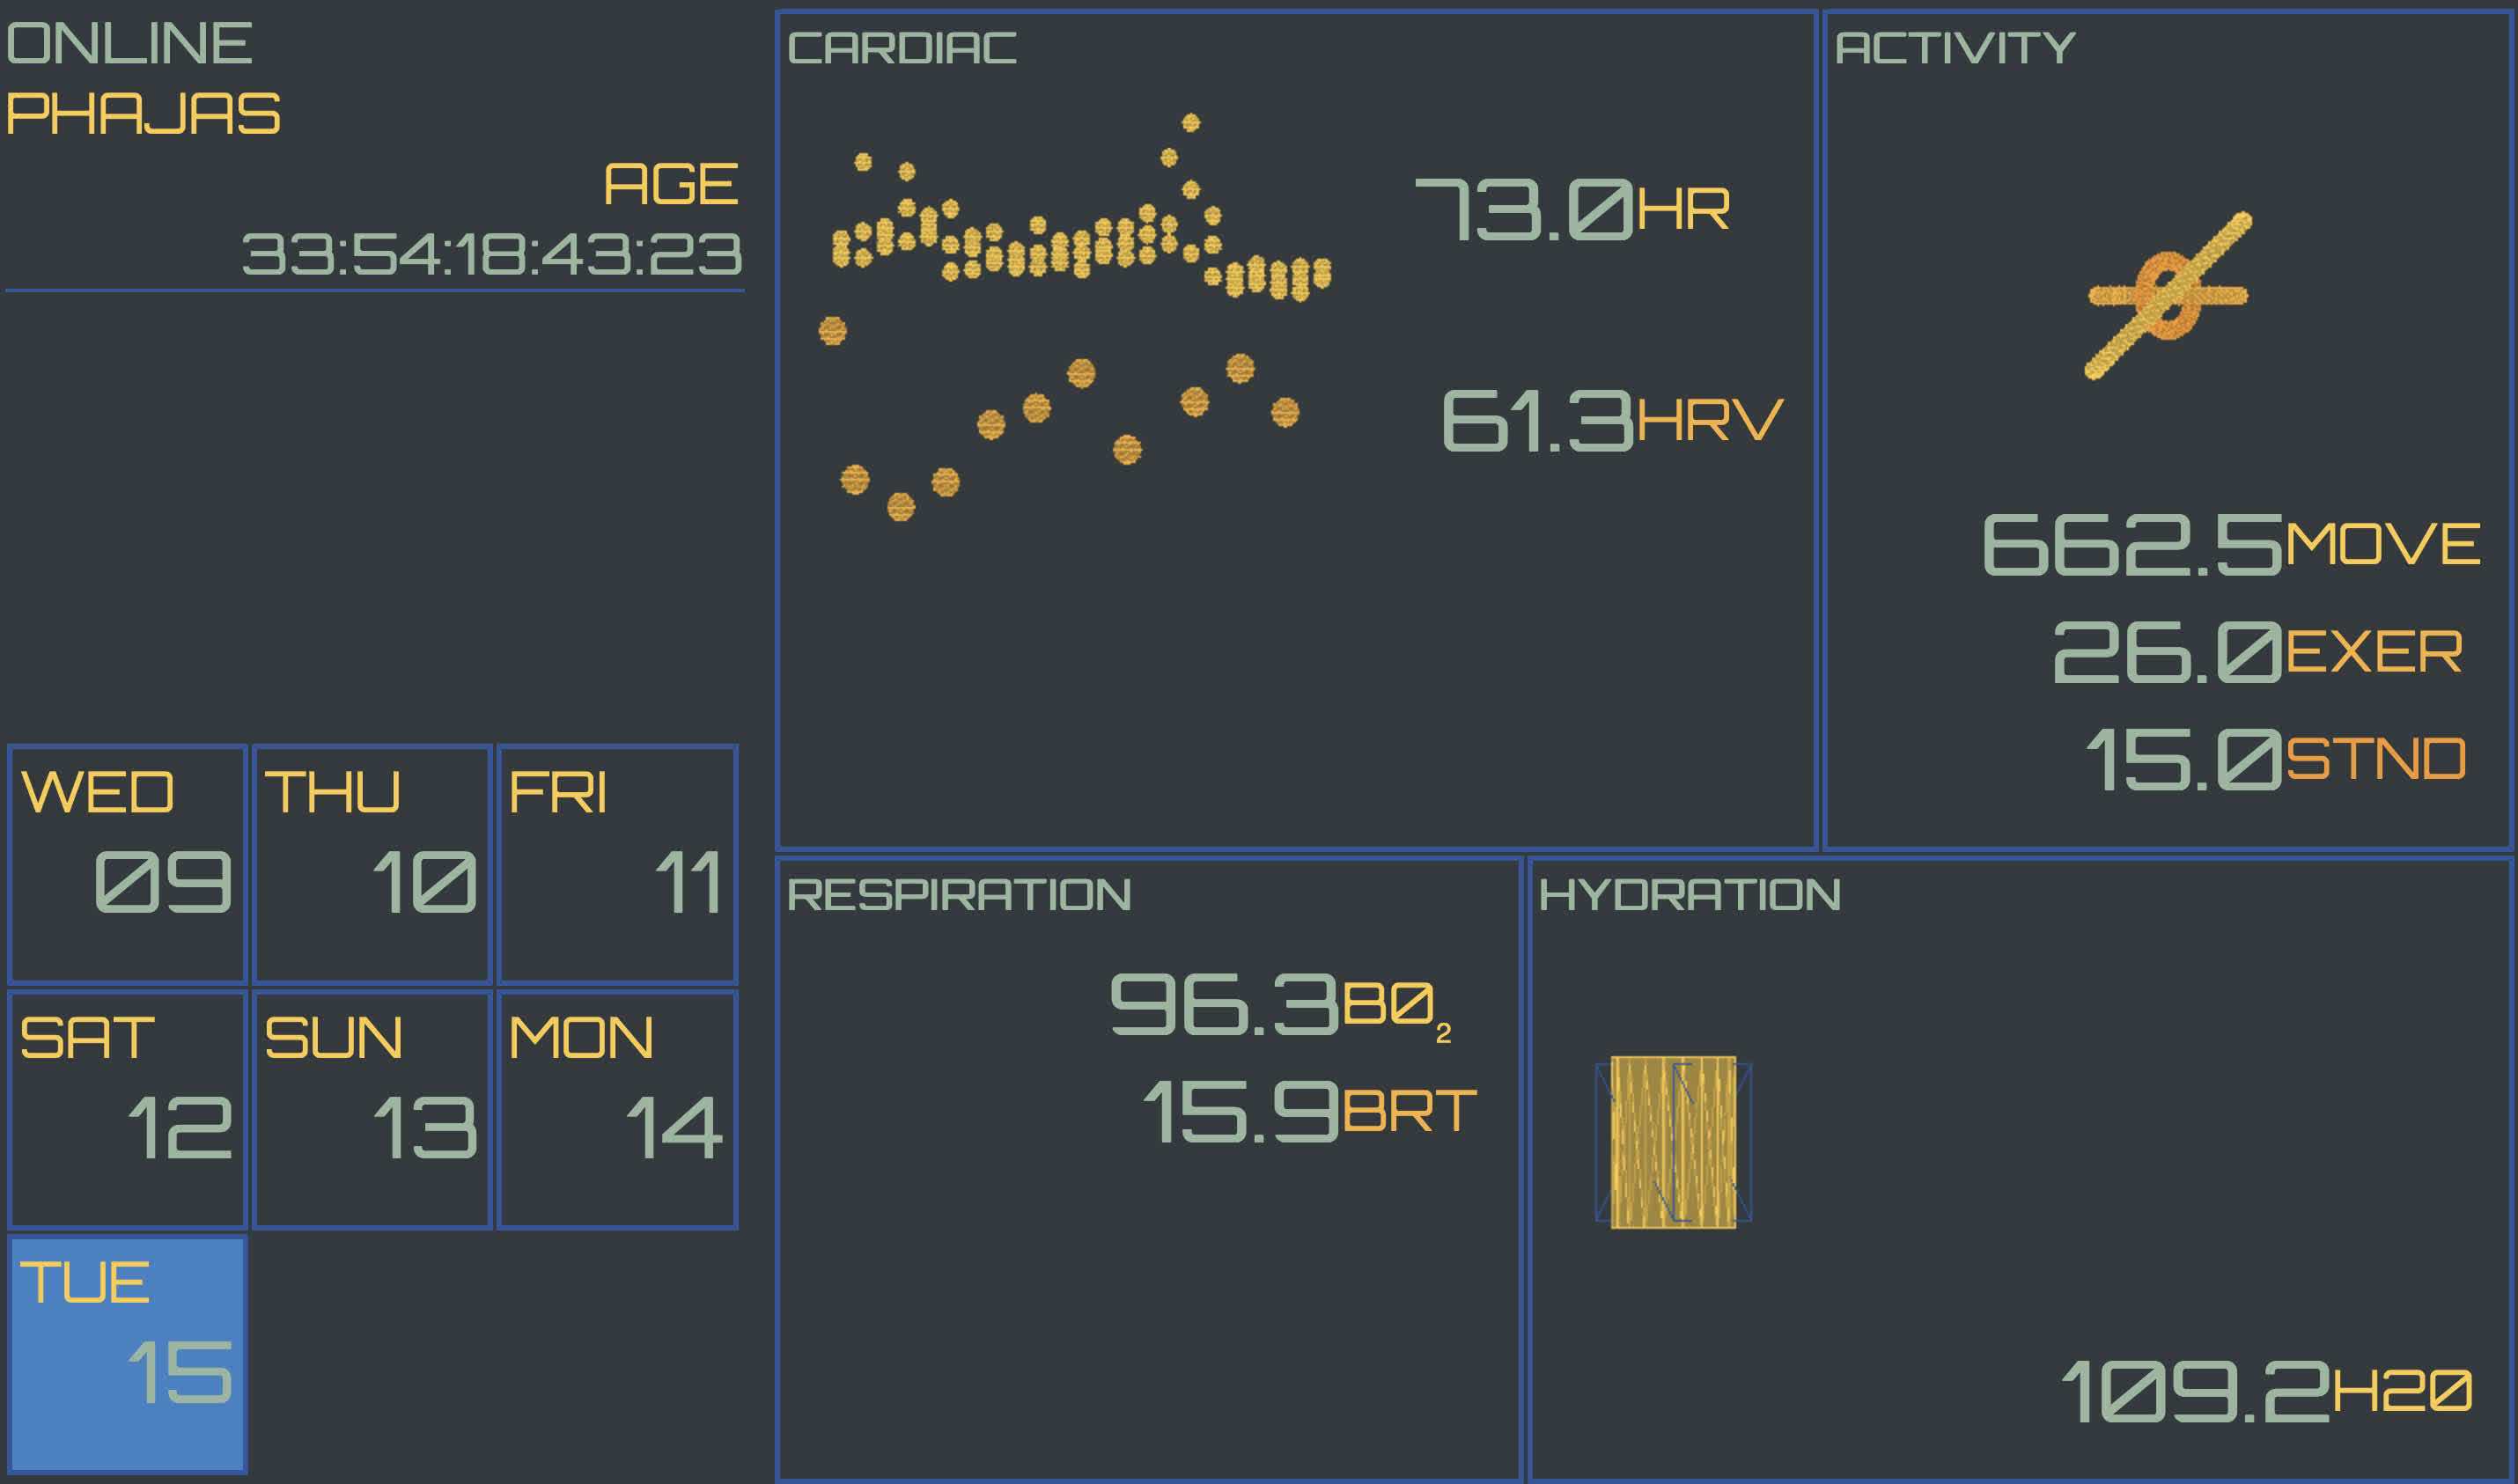
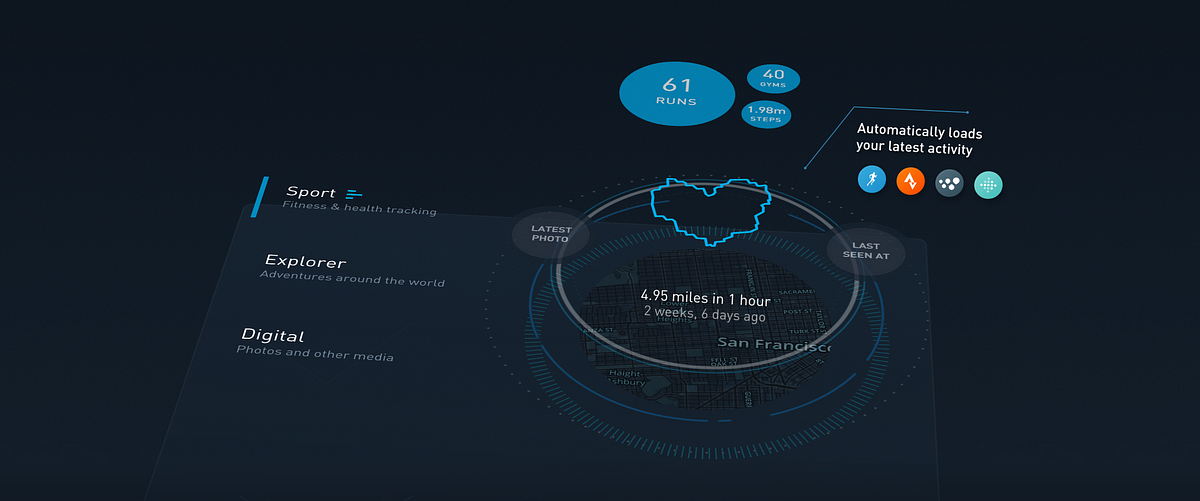
The site is themed after the visuals in the 2013 film Oblivion, which is a great movie with excellent futuristic UI (and music). I found a page by one of the visual artists explaining how they built the UI for the movie. I like the clean lines, simple colors, and graphs. I used this as inspiration for building the website itself - a cool futuristic font, a neat color palette, and 3D graphics animating in a subtle way.
I got feedback from friends and family - thanks to James and Charles for pushing me to use a consistent palette, and thanks to my sister for pointing out that my previously chosen palette was ugly.
Health data automatically through my watch, which I've worn since April 2015
Food, which I have logged since March 2019
Hydration, which I have logged since December 2018
It's not hard or irritating for me to log when I eat or drink, and it makes me more mindful of what I do end up ingesting.
The site is populated by the Health Auto Export app, which runs in the background on my phone. It takes my HealthKit database and periodically slurps up the last 7 days of data and sends it to the website. I like this because I don't have to think about the site at all - I just log data like I normally do, and it shows up on the Peterometer after a few days. I like that the Peterometer fits seamlessly into habits I've already built.
The Site
I use the Three.js library for rendering the 3D data. I wrote some code to line up Three.js objects with DOM elements, which made it easy to use flexbox to position the elements of the site. The site is responsive to window size changes.
Next Steps
I have a 3D scan of my body that I'd like to add to the page. I wish I could use a tool like ffmpeg to downsize the model, make it low-poly, and put it on the site. If you know how to do this, email me!
I would also like to have a display in my home dedicated to showing this information. It would be nice to see this as a kind of "Peter Health Dashboard" throughout the day, and it may end up influencing my behavior.
I hate ads. I don't like watching them, I don't like seeing them, and I don't like hearing them. The attention economy is very sad and I want no part of it. "Ethical ads" are about as oxymoronic as "healthy cigarettes". A friend recently told me that advertising reduces activity in the decision-making parts of your brain.
Funnily enough, the more visual ads are, the easier they are to avoid. Here is how I avoid most advertisements.
Avoiding Audio Ads
This one is easiest to set up. Most podcatchers support a different "Skip Forward" and "Skip Backward" duration. Everyone I know who listens to podcasts has these set to "Skip forward 30 seconds" and "Skip backward 15 seconds". Each time you hear the start of an ad about a great new mattress (that the hosts only ever have in their guest room), or a non-FDA approved CBD vendor, you skip forward 30 seconds. You keep pressing this until the show - the thing you're there to listen to - comes back on, and then you back up by 15 seconds until you're between the ad and the show.
Usually this means you're still subject to "thanks to our friends at _" narration, perhaps with a coupon code, but it's better than listening to the whole ad.
Avoiding Web Ads
This one takes a bit more effort, depending on how far you want to go. I use ad blockers (extensions that run on your device) to block web ads. These involve filters or rules to omit content from webpages before it is rendered (or in some cases fetched). I use 12+ of these on my devices.
I also run pihole on a computer in my house, and route all my internet traffic through it. This filters out content before devices fetch it by blocking the domain name resolution of advertising and analytics. This accounts for a shockingly high 8% of all domain queries on my network.
Avoiding Video Ads
This one takes the most effort to configure, but it's well worth the setup time. I love web video, but hate the ads that hosting providers and content creators sprinkle in their videos. For avoiding ads that the site inserts (usually for vacation rentals and car insurance), I use yt-dlp. This program downloads a video to your local computer, and you never need to see the pre-roll / mid-roll ads the hosting provider inserts.
To avoid ads that content creators place in the middle of their videos (for VPN services and wallets, usually), I use the --sponsorblock-remove flag of yt-dlp. There's a community-maintained database of ad segments of videos called SponsorBlock. The --sponsorblock-remove flag hits this database, finds the time codes for the ad segments, and then stitches them out of the video file. This feature is awesome, and there's a list of the different types of video segments that SponsorBlock can stitch out.
I've mapped my invocation of yt-dlp to a simple hotkey, so with one keypress I can download and watch (ad free!) any video link in my clipboard.
I hope this article was helpful for avoiding ads in your day-to-day life. These techniques help me move through the cloud of engagement metrics and sketchy tracking, and towards a place where I own my time and attention.
I recently learned about TiddlyWiki. It's wiki software that you run on your computer.
There are lots of these "second brain" pieces of software - Notion, Obsidian, vimwiki. But TiddlyWiki has some special tricks up its sleeve that I think put it into a league of its own. There are two components of it that I find so intriguing.
It includes its own viewer and editor
If I were using vimwiki (which I used to, heavily!), I'd store all my files on my computer (like in ~/.vimwiki, which I had symlinked to my NextCloud instance). But I'd need a way to view and edit those files. I used vim and Marked 2. TiddlyWiki is a self-contained HTML file. It has everything in it - the editor, the viewer, a filesystem implementation, but it's all saved to one HTML file. This is very novel - it's the ultimate portability. I can sync one file to copy my entire database, viewing experience and all. I can make copies of to back it up or try new things.
It is built in itself
This TiddlyWiki's superpower. It is a tool that is built inside of itself. Besides a small kernel of core functionality, the rest of the system is represented as "tiddlers" - individual notes / files. The sidebar menu, the story list of tiddlers, the editor toolbar, all of this is represented as Tiddlers. This makes it very easy to add new functionality to these views. For example, I added an Emoji picker and indicator to all my Tiddlers in a few minutes. This can be done with the embedded powerful template language. TiddlyWiki supports key-value storage (called "fields") on tiddlers, enabling you to make your own taxonomy and relationships.
To help you wrap your mind around this concept, here are things that are just tiddlers in TiddlyWiki:
the menus and user interface
the stylesheets that customize the UI
the user settings (metrics, themes, behaviors)
the state of the wiki, like open tiddlers
plugins, which can contain JavaScript, CSS, and tiddlers
keyboard shortcuts, including the ability to make your own
Much of this UI comes from use of tags, which is just another field on a tiddler. This lets you put things into the system easily. If you want a new item in the sidebar, just tag it with $:/tags/SideBarSegment. If you want something new in the view for each tiddler, tag it with $:/tags/ViewTemplate.
I found this software a few days ago, and I've already become enamored with it. I think this site might eventually become a TiddlyWiki.
My home is powered by Home Assistant, which is a great software package for running a smart home. In this post, I'll talk about how I'm automating my home declaratively rather than using an "if-this-then-that" approach.
Lighting The Patio
We have lights on our patio. I want them on if:
it's after sunset and before 9:00PM
or
the patio door was opened within the last 3 minutes at night (if I'm going outside, or letting the dogs out)
The Classic Model: "If-This-Then-That"
If you did an "if-this-then-that" approach, you might have rules like:
if it's after sunset but before 9:00PM, turn the lights on
if the back door opens while the sun is below the horizon, turn the lights on for 3 minutes
While these rules sound simple, they have edge cases that will bite you when the cases fight each other. Imagine I'm letting the dogs out at 8:59PM. Following the above rules:
Door opens at 8:59PM, and the lights turn on
9:00PM comes, and the lights turn off
I'm out in the dark!
You could solve this by introducing more state. You might add a "lights on due to time" and "lights on due to door opening" state to bookkeep when to perform actions of the automation. But what if we add another rule? For example: if the back camera detects a person or dog, turn the lights on for three minutes.
Adding additional "what am I doing" state makes the complexity explode for state bookkeeping.
A Declarative Model: "Should" State
In my smart home, I take all this input state and derive a "should be" state out of it. The patio light automation has just one rule:
If the patio lights should be on, then turn them on. Otherwise turn them off.
I define these "should be" states with simple boolean logic in a template binary sensor. Here's the one for my patio lights:
template:
  - binary_sensor:
    - name: "Patio Lights Should Be On"
      delay_off:
        minutes: 3
      state: >
        {% set before9 = now().hour < 21  %}
        {% set doorOpen = states('binary_sensor.patio_door') == 'on' %}
        {% set night = is_state('binary_sensor.night', 'on') %}
        {% set people = is_state('binary_sensor.patio_person_motion', 'on') %}
        {% set dog = is_state('binary_sensor.patio_dog_motion', 'on') %}
        {{ night and (before9 or doorOpen or people or dog) }}
I have a simple blueprint, binary_sensor_entity, that manages these automations for me:
blueprint:
  name: Binary Sensor to Entity
  description: Tie a binary sensor (likely from a template) to an entity state
  domain: automation
  input:
    source_sensor:
      name: Source Sensor
      description: This sensor will be used to drive the entity
      selector:
        entity:
          domain: binary_sensor
    target_entity:
      name: Target Entity
      description: The entity to be driven by the sensor
      selector:
        entity:

variables:
  source_sensor: !input source_sensor

trigger:
  - platform: state
    entity_id: !input source_sensor

action:
  - service: >
      {% if is_state(source_sensor, "on") %}
        homeassistant.turn_on
      {% else %}
        homeassistant.turn_off
      {% endif %}
    entity_id: !input target_entity
This makes the patio lights automation very simple:
My entire home is driven this way. I think this is easier to understand and extend than the classic way of doing Home Assistant automations. I also prefer it over Node-RED, although I still use Node-RED for some tasks in my home (this may be a subject of a future post).
I like how well this addresses the edge case described above, and how easy it is to experiment with new states driving the "should be" sensors. I tried keeping the lights on during severe weather (I have since removed this), and it only took one change to the "should be" sensor for the patio lights. These sensors are also really easy to debug - you can view them in the History section of Home Assistant.
Please feel free to drop me a line if you have any feedback on this post. Thanks for reading!
I recently took a week long vacation. I love working on recreational programming projects during a vacation. It's a great chance to try programming in a space I am less familiar with.
This vacation, I worked on something I've wanted for a long time: a Pokémon map generator! I've always been interested in the maps in the Game Boy Pokémon games (read more about parsing the data format and visualizing the map connections). There was something magical about exploring these areas, pouring over towns in strategy guides, and designing my own maps on paper.
Generated Maps
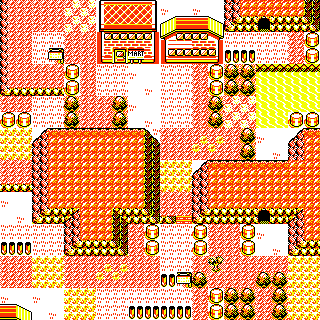
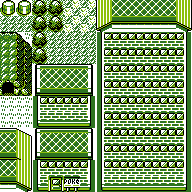
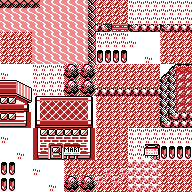
I love looking at the maps you can generate with this. Here are a few of them that stood out to me:
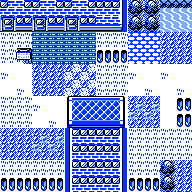
A Town with a Cave
Shop by the Sea
Skyscraper By a Lab
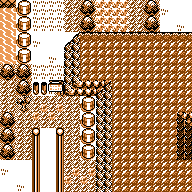
Mountain Route
The Super Nintendo Room
The Algorithm
In addition to letting you visualize maps from Pokémon Red and Blue, this site also lets you generate your own maps using a (naive) Markov-style approach.
Here's how it works:
I wrote a small python program to gather data from the pokered repository in JSON format. It scrapes out the built-in maps and their metadata, the blocksets, and the tilesets.
When you click "Generate", we find all the maps in Pokémon that have the tileset you chose.
For each of these maps, we record their blocks and what blocks neighbor them. For example, if block 77 in OVERWORLD has block 12 north of it in a map, we record this. I also record the frequency that these blocks occur, but this is not currently used in map generation. These neighbors are stored in a dictionary.
Starting from the top-left, we choose a random block that is known to be used by maps with this tileset. These are just the keys for the above neighbors dictionary.
We then fill the map from left to right, top to bottom, trying to find blocks that can fit in with the constraints of the already built map. If the map is unsatisfiable, it's thrown out and we attempt again (up to 2000 iterations - and we may sometimes never find a solution). This is part of the generation algorithm that I'd like to improve and get feedback on.
Once the map is complete, we render it using the techniques described below.
Note that it has bugs! I'd recommend not getting larger than 8x8 for most tilesets. Some tilesets are missing, like "DOJO" and "REDS_HOUSE".
Rendering Maps
To render both built-in and generated maps, the site uses a similar mechanism to my Emoji-based approach (although much faster than rendering all that unicode!). It parses the tileset and blocksets, and renders them using <canvas> into an image element. This is great for saving the map for use offline.
Because of my very fond nostalgia for the Game Boy Color, I also added support for rendering using multiple palettes. The Game Boy Color could switch palettes based off of the button combination you held down when it booted. As a kid, I found it fun to hold down the buttons and see what cool palettes I could see Pokémon in. I also added a "grayscale" and "gameboy" palette for completeness - you can see maps rendered in their green original Game Boy glory!
I had fun building this generator, and I hope you have fun playing with it! Get in touch if you have questions, feedback, or if you generate any really cool maps!
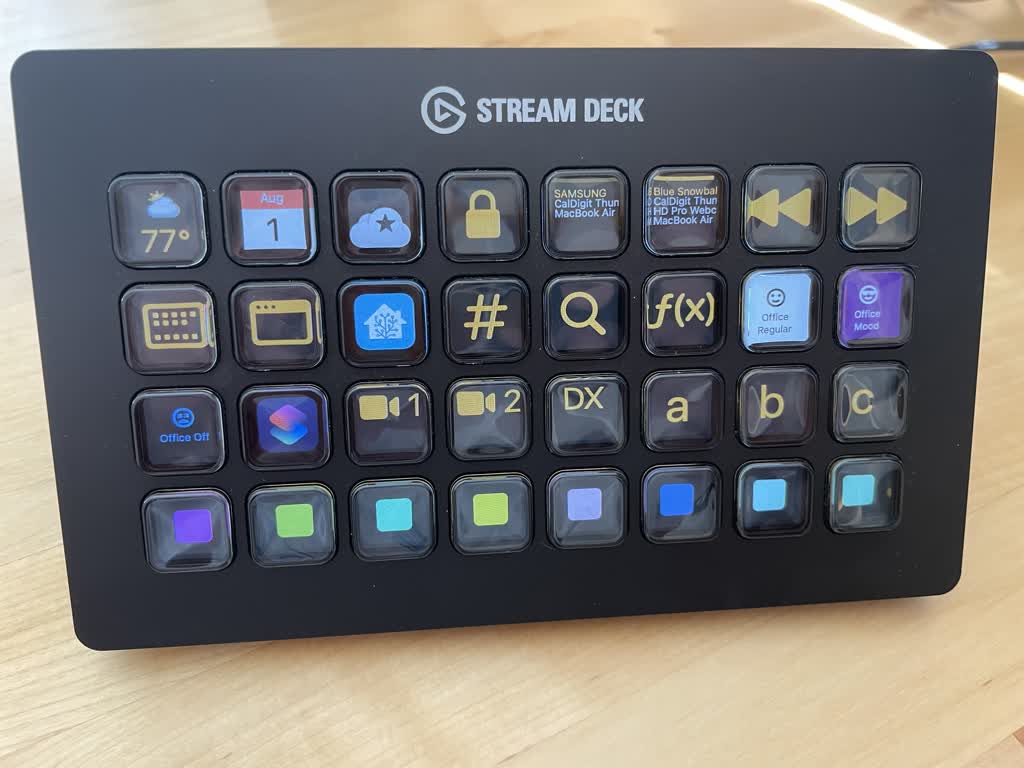
Last September, I bought an Elgato Stream Deck XL. It's a USB input device with 32 programmable buttons, each with an individual display. I think the target market is video game streamers, who use it to switch cameras, control lighting, play sound effects, and do star wipe transitions. I don't stream video games, but I've found myself using the Stream Deck frequently with my computer. This post shows what I'm doing with it and how I built it.
Hammerspoon and hs.streamdeck
I don't use the Elgato Stream Deck software. Instead, I use Hammerspoon, the amazing macOS customization tool I've had for years on my systems. You configure it with Lua files, and there is a module for using the Stream Deck called hs.streamdeck. This module lets you:
run a callback when a Stream Deck is connected or disconnected
react to button press-down and press-up events
assign images to buttons
set brightness
My Stream Deck Toolkit
Using the Hammerspoon support, I built a declarative toolkit for populating the Stream Deck as part of my dotfiles. I define buttons as Lua tables with simple properties like image and onClick callbacks. My toolkit also supports navigation stacks, scrolling, and "panels" - buttons where X and Y on the grid are important (like in the number pad and clone window buttons below).
This toolkit lets me write buttons very easily, and experiment with new functionality quickly. Making it easy to iterate was essential to my success with this project. For example, the button to lock my computer is a few lines of Lua:
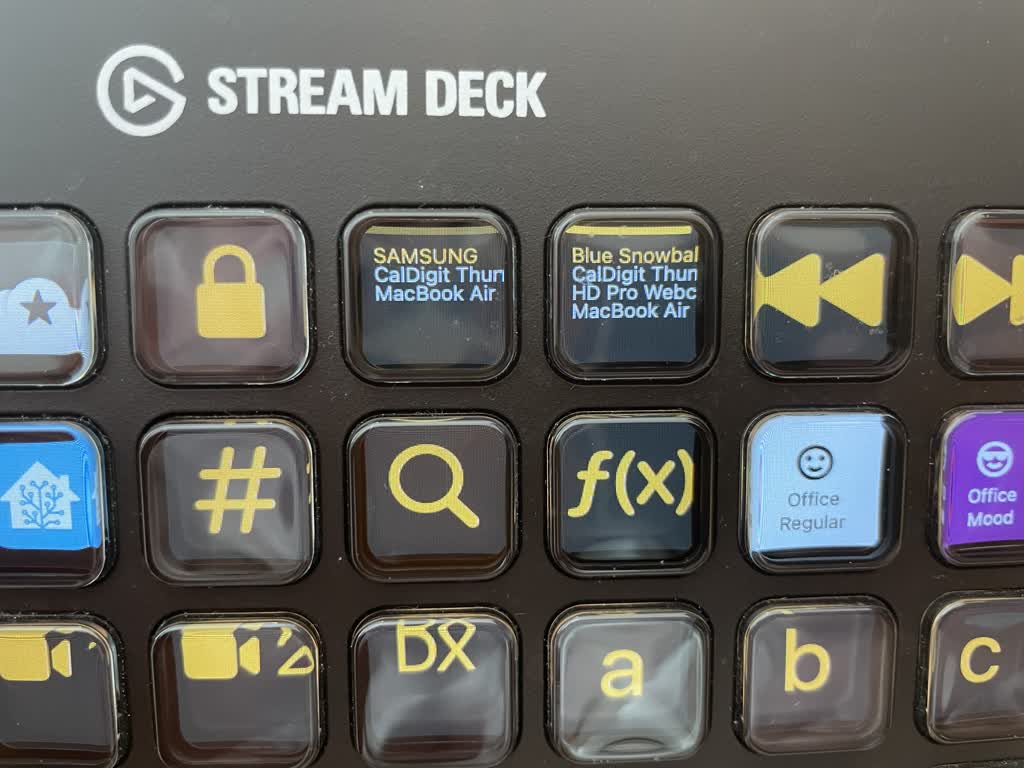
Audio: shows my connected output and input devices. This helps when switching between audio devices during meetings. These buttons also show a little bar indicating the selected device's current volume (dimmed if it does not support volume)
Media Controls: Skips tracks. I don't use these very much
App Switcher: Pushes a grid of open apps onto the navigation stack. Each of these buttons act as peek buttons for that app
Window switcher: Pushes a grid of open windows, with snapshots and app icons, onto the navigation stack. Pushing one of these makes that window frontmost
Home Assistant: Pushes a grid of all my Home Assistant entities onto the navigation stack. This lets me control lights, switches, scenes, run scripts, etc.
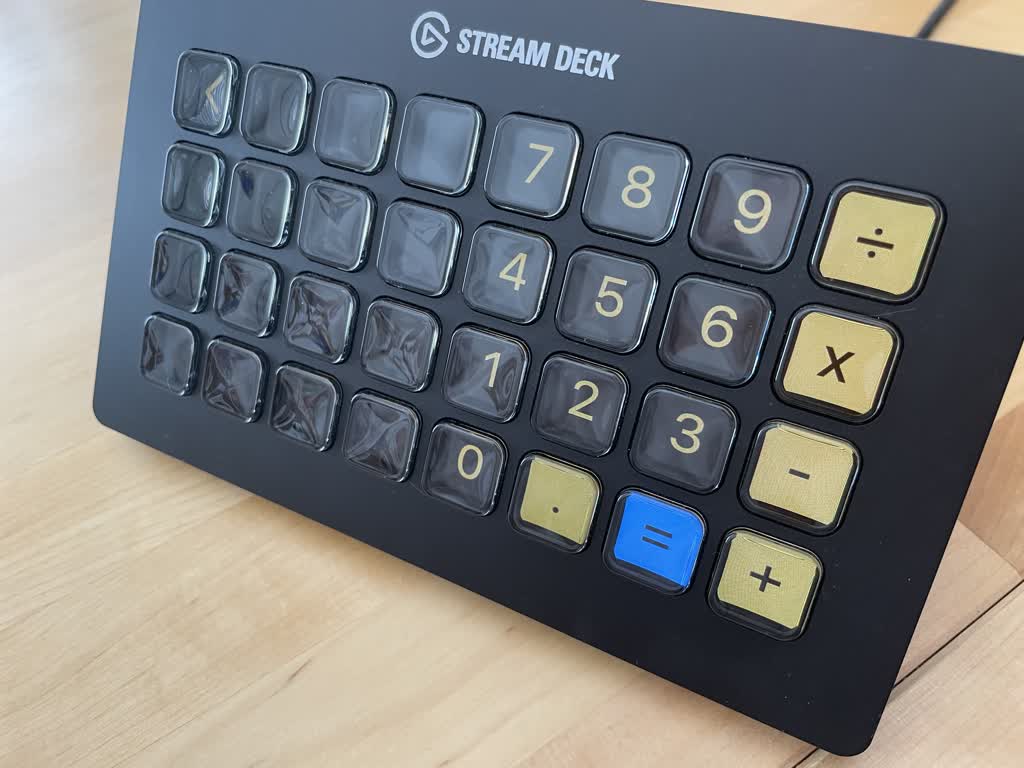
Numpad: Pushes a panel which is a software number pad / calculator for the currently foreground app
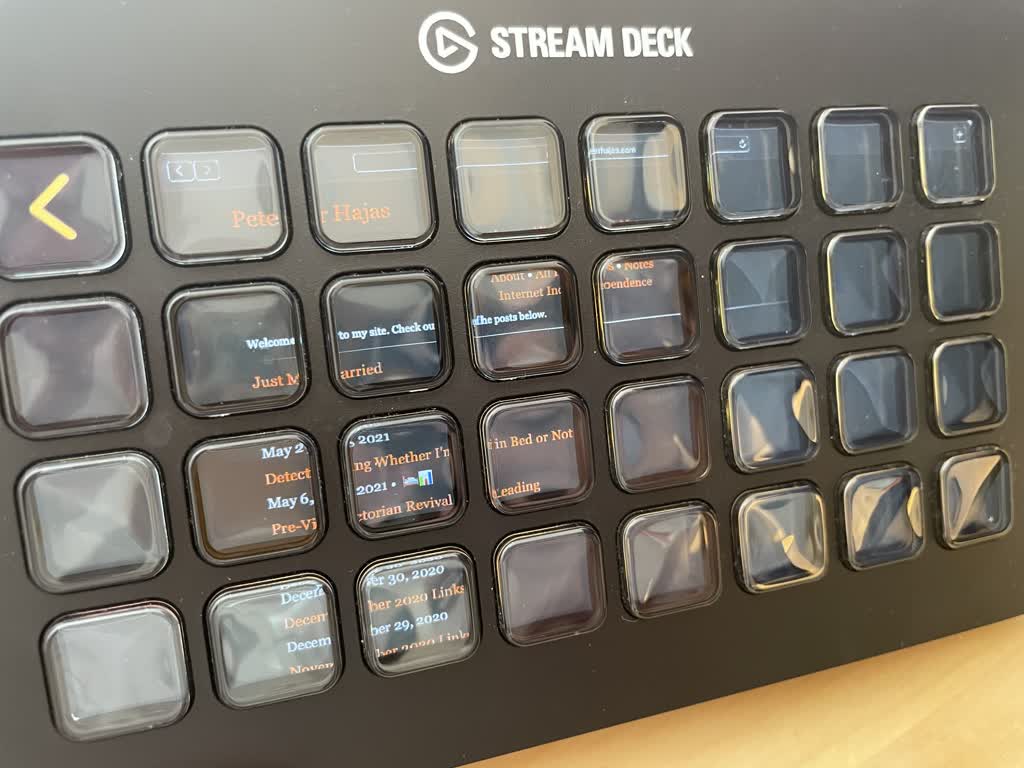
Window Clone: Pushes a grid of open windows onto the navigation stack. Selecting one pushes a panel-based live-updating version of it on the Stream Deck. This can be handy for keeping an eye on something, and lets the Stream Deck act as a slow-updating external display for a window
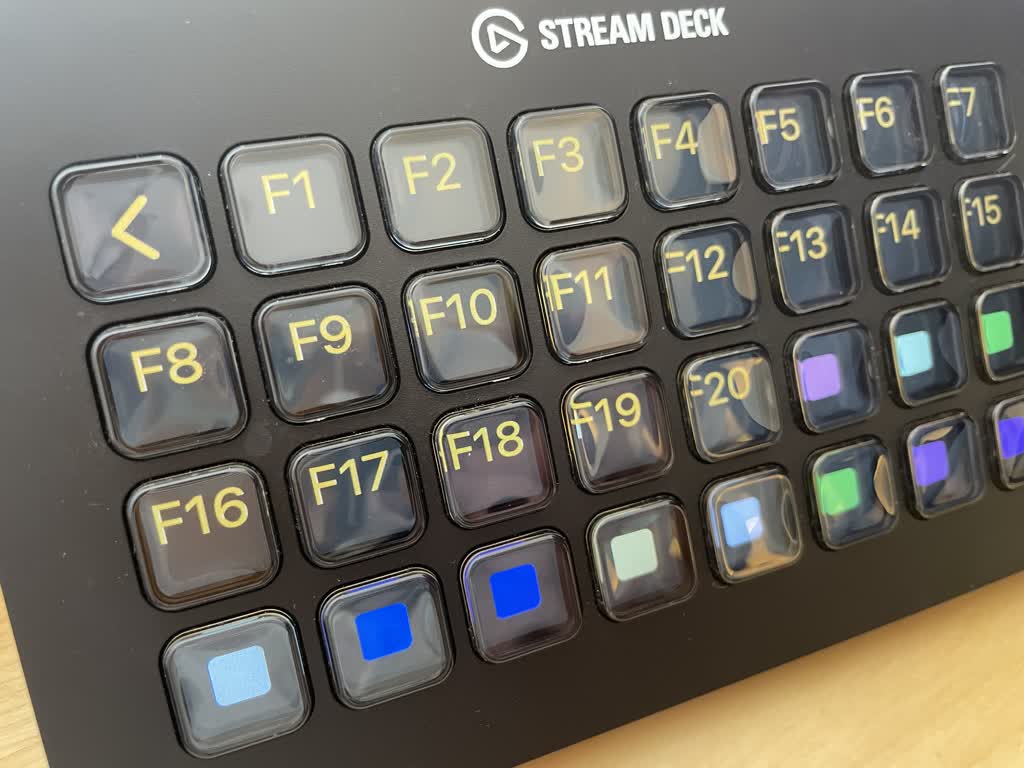
Function Keys: Pushes a grid of software F-keys, going from F1 to F20
Office Regular, Office Mood, Office Off: Each of these act as shortcuts to activate a specific Home Assistant scene in my office
Shortcuts: Pushes a grid of my Shortcut folders onto the navigation stack. From these, I can pick a Shortcut and run it from the Stream Deck
Camera 1, Camera 2, Dash Close: Shows a camera feed from an external camera on my "dash" display in my office (a subject of a future post). The "dash close" button lets me close any open windows on my dash display
Shelf A, B, and C: lets me store anything on the clipboard into a scratch buffer and later recall it by pressing the button. Holding the button clears that buffer
The colored buttons at the bottom are nonce buttons. They show a random color and cycle between it at an interval, because it looks cool.
If you like what you see, or if you end up using my toolkit, please write me an email!
I've been learning about and using Home Assistant for the past few months. It's an open source home automation platform, but it can be turned into much more. It's kind of like your own personal "if-this-happens, do-that" service.
At the core of the system are entities, which represent stuff the system knows about. Entities are prefixed with their type, for example person.peter_hajas, light.bedside_table, sensor.patio_temperature, or sun.sun. Home Assistant supports a suite of user-authored entities for sensors (things that feed the system data), commands (actions triggered by the system), and semantic devices (like "covers", Home Assistant's catchall for garage doors, sun shades, etc.).
Building the Sensor
One of the platforms for a binary sensor (determines if something is true or false) is the Bayesian binary sensor. This lets you use Bayes' theorem to combine observations into a sensor value.
While spending some time at my home alone recently, I wanted to play with automations keyed off of whether or not I was in bed. This could be used to shut off lights and turn off appliances. I've read about some of the bed occupancy sensors you can build, but I wanted to see how far Bayesian sensing could get me.
These sensors are written in YAML. You describe a prior (at any given time, how likely is it this is true?), an optional threshold (only be true if the chance is above the threshold), and observations. These observations are in terms of entities or Home Assistant templates. Here's a breakdown of this sensor:
There's a 33% chance I'm in bed, represented by the prior. This assumes I spend 8 hours in bed.
I only want the sensor to trigger when the sensor is at least 90% confident. It'd be annoying if it activated at a lower threshold. This is set in probability_threshold.
If I'm at home, there's a 50% chance of me being asleep (this is a bit less true while working from home, but tracks for a typical commute schedule).
If my phone is charging, there's a 75% chance I'm asleep. I usually only charge at night, so if I'm unplugged, there's only a 5% chance of me being in bed.
If the sun is below the horizon, there's a 75% chance that I'm in bed.
If my workstation (Orion) is not active, there's a 40% chance that I'm in bed.
How Well Does it Work?
I'd say it works pretty well. Some observations:
It's awesome to throw the phone on the nightstand charging pad and have everything shut off.
It stinks when I charge my phone at night and everything turns off. I might need to play with the probabilities (if my machine is logged in, there's basically a 0% chance I'm in bed, for example) or add other sensing (did another room recently see motion?) to help in this case.
I have yet to try it with multiple users :-). My wife (yes, wife! More on this in a future post) would need her own version of this sensor to enable turning lights off, otherwise I could leave her in the dark.
A thought that has stuck with me is this passage from The Diamond Age:
One of the insights of the Victorian Revival was that it was not necessarily a good thing for everyone to read a completely different newspaper in the morning; so the higher one rose in the society, the more similar one's Times became to one's peers'.
I think about this a lot when it comes to the news. In the Stephenson Diamond Age-sense, I strive to read like the pre-Victorian Revival (or lower-status) folks.
Thanks to the power of feeds, I have tailored my reading experience exactly to my liking. As I read more, I end up collecting feeds of people's writing I find interesting (from friend recommendations, Hacker News, and other sources). Each time I discover a new feed, I do a deep dive on the page contents to come up to speed. As I get more feeds, I find myself reading aggregators less, and other sites more.
I find myself less inclined to habitually check for the next piece of information. This leaves more time for creative pursuits, spending time with my family and friends, and critical thinking.
If you're willing to change your habits, I've found that this manner of reading can be very fulfilling.
Coffee affects the diaphragm and the plexus of the stomach, from which it reaches the brain by barely perceptible radiations that escape complete analysis; that aside, we may surmise that our primary nervous flux conducts an electricity emitted by coffee when we drink it. Coffee's power changes over time. Rossini has personally experienced some of these effects as, of course, have I. "Coffee," Rossini told me, "is an affair of fifteen or twenty days; just the right amount of time, fortunately, to write an opera." This is true. But the length of time during which one can enjoy the benefits of coffee can be extended.
This is a great essay with some vivid descriptions of coffee from 1830.
There's never been a better time to get a website!
Rather than speaking your mind through a centralized service, you can get your own place on the internet to share. It's much better to have your own platform for expressing yourself and sharing your passions.
Get Hosted
Hosting is inexpensive. A simple web host can cost you less than $80 US per year. You could also use a free service like GitHub Pages, but I feel most comfortable with a service I'm paying for. Be sure to check the terms of use for the service before using it. It's important to understand specifically what could cause the provider to deny you service.
Make Your Site
Webpages are written in HTML and styled with CSS. While this may seem daunting if you've never written code before, it's easy to get started. Mozilla has some good resources for learning web development. You can follow along and have a simple page up quickly.
Do Your Thing
This is the fun part! Share your passion with the world, start writing about your thoughts, ideas, and interests. Writing is really hard work (something I'm trying to work on) and having a website can be a good way to work on this important skill. I've discovered that I feel the best about my writing when I'm writing for myself. Writing the type of stuff I would like to read. This is better than whatever will get the most points on an aggregator or social site.
Now is a great time to get a website! If you make your own site, please write to me.
I love websites that are great expressions of the medium. Many of my favorites do one thing well. One of my favorite sites is www.stilltasty.com. It has a simple purpose:
How long will your favorite food or beverage stay safe and tasty? What's the best way to store it?
Do you know about McDonaldland? It's the fantastical world of fictional characters created by McDonald's. Ronald McDonald, Grimace, Birdie, the Hamburglar, etc. These were staple characters in the 80s and 90s.
I recently wondered: how large is the McDonaldland universe? Let's explore this question.
Ronald McDonald was in advertisements with a lot of popular characters to promote the McDonald's restaurant. A notable one was this ad where Ronald and Grimace run into Mario, from Super Mario Brothers. This means Mario, Peach, and the Mushroom Kingdom are in the McDonaldland universe. Pretty cool! Let's see how deep this goes.
Mario is a very popular character, and has appeared in games with many other characters. For example, Mario's presence in the Mario & Sonic at the Olympic Games series. This means the characters of Sonic are also in McDonaldland.
Sonic is also very popular. In 2013, he appeared in the "Worlds Collide" Archie comic. This involved a crossover with the Capcom character, Mega Man. This means that Mega Man also resides in McDonaldland.
Capcom pursued some ambitious games with their characters. A popular title was 1998's Marvel vs. Capcom: Clash of Super Heroes where Capcom characters (including the Blue Bomber, Mega Man) appeared alongside Marvel superheroes. All of the Marvel characters (Iron Man, Rogue, Wolverine, etc.) are part of McDonaldland.
Marvel characters haven't just appeared in crossovers with their own properties. There were two comics where the characters of the Marvel universe also met with the crew of the Enterprise from both the original series in "Star Trek/X-Men" and the Next Generation in "Planet X". All of Star Fleet exists in McDonaldland.
The Star Trek characters were in many films, books, and comics. An important one for the McDonaldland continuity was the "Star Trek/Green Lantern" series. This involved the crew of the Enterprise meeting the Green Lantern. Unsurprisingly, the DC Comics characters also exist in McDonaldland.
There were other comics featuring The Terminator. One put him in the middle of a triangle against two other battling foes in Aliens versus Predator versus The Terminator. This means the characters of "Alien" (Ripley, Peter Weyland, the alien, and others) are in McDonaldland.
The Alien franchise didn't just feature in the popular films, but also video games. An important title was 2015's Mortal Kombat X. Here, you could play as Alien and fight Freddy from "A Nightmare on Elm Street". Freddy Krueger also exists in McDonaldland.
Freddy Krueger also appeared in Mortal Kombat (9) alongside some other characters. The roster included Kratos from God of War, another resident of McDonaldland.
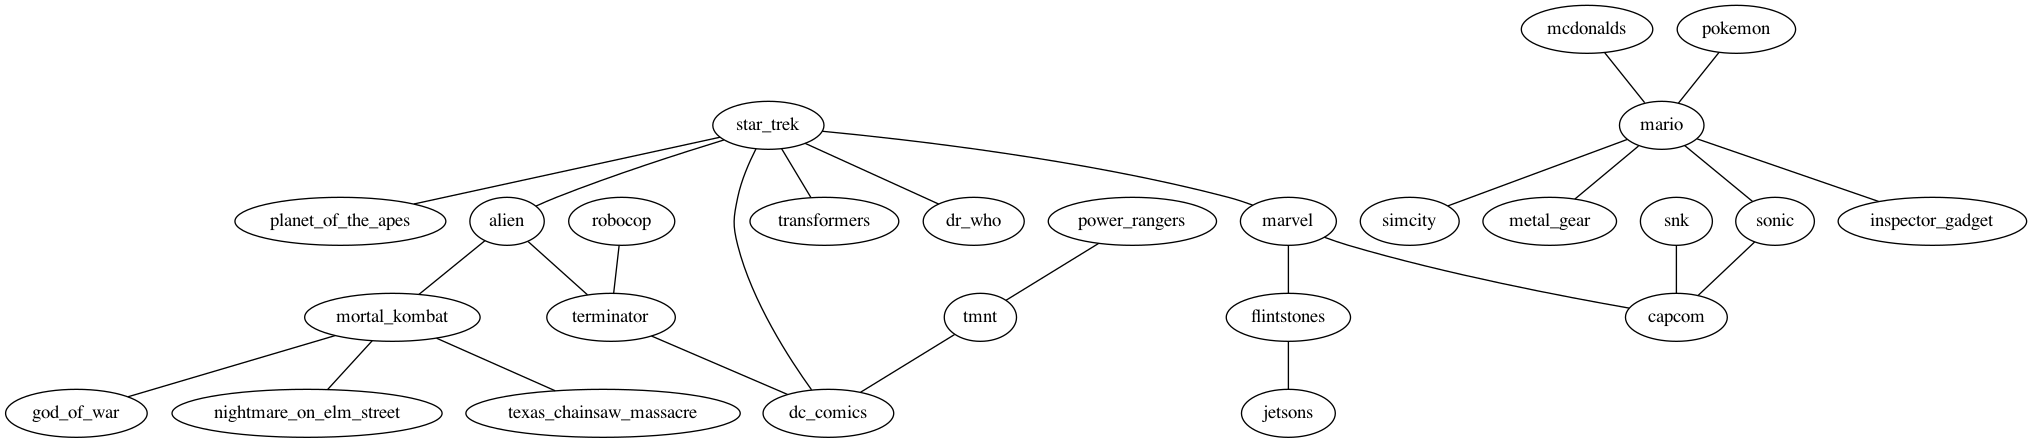
The McDonaldland Multiverse (also called the McDonaldland / Mario / Sonic / Mega Man / Marvel / Star Trek / DC / Terminator / Alien / Nightmare on Elm Street / God of War Multiverse) is an expansive one. To help visualize it, I prepared this DOT file which you can see here:
A quick note: the pokered repository has changed since I wrote this post, and the graphics are now always in png format. As a result, you'll *need to generate the 2bpp files yourself to follow these steps. Thankfully, running make in the pokered root will generate these using rgbgfx from the RGBDS project. Here's a sample invocation:
I previously wrote about visualizing the connections between maps in Pokémon Red and Blue. Next, I wanted to explore how the game's maps work in more detail. I couldn't find any documentation about how to read the map data. I spent some time understanding the format which I want to document here for anyone else looking to parse maps. Special thanks to the folks on the "pret" Discord channel whose comments I studied in an effort to understand the map format.
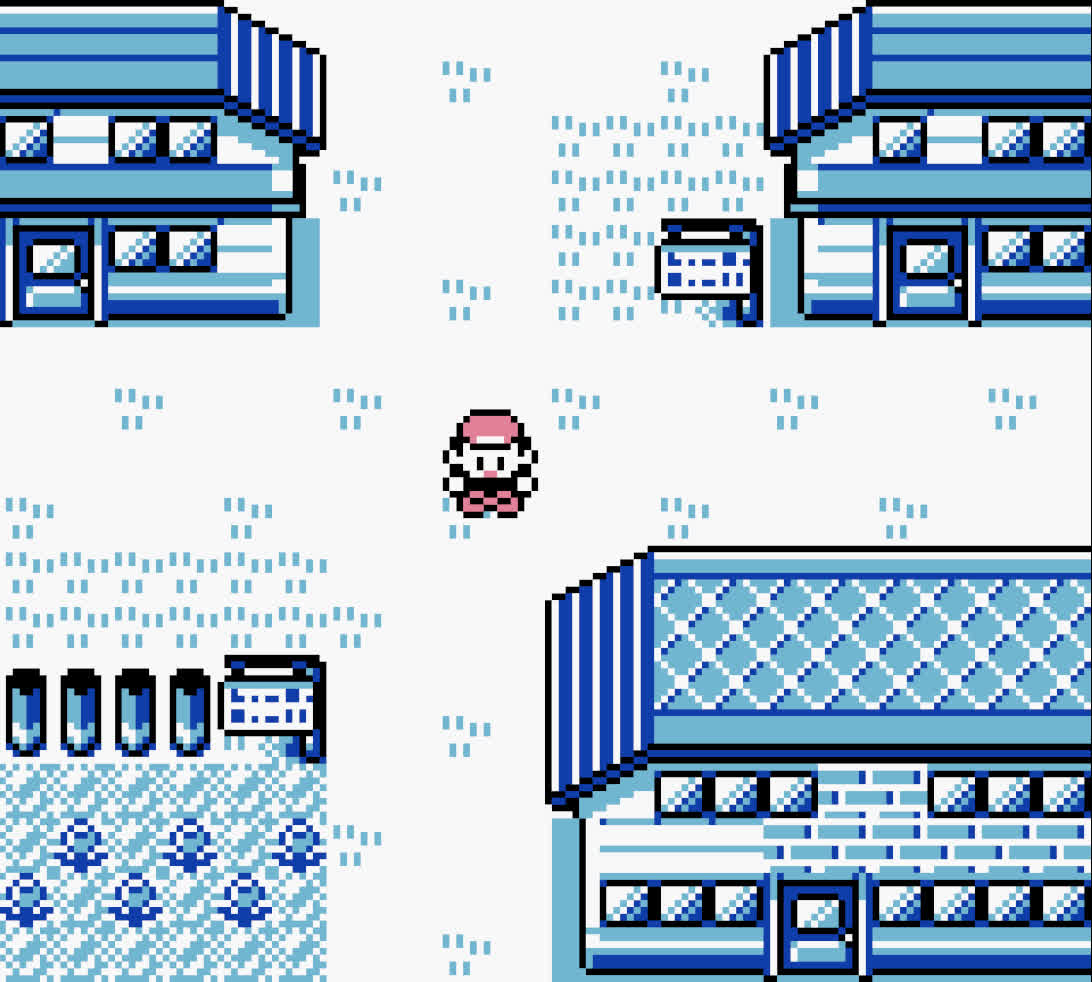
Starting in Pallet Town
We'll use the game's starting area, Pallet Town, as an example. If you haven't played Pokémon Red and Blue, it looks like this:
In the pokered repository, individual city, route, and interior maps are stored in the maps directory as .blk files. Within the Pokémon map editing community these are known as "blockfiles".
Somehow, these 90 bytes are what the game needs to render the starting town. But how?
Pallet Town measures 20 squares wide by 18 squares tall (where a "square" is the size of the player character). Surely there must be a 20x18-element grid that tells the game "blank space, left side of house, grass, water, etc.", right? But 20 x 18 = 360. If these 90 bytes were used to encode this information, that would mean we'd be allocating 4 "squares" of information per byte, which would only allow for 2 bits-per square. This would restrict us to 4 types of squares for the game. There are more types of tiles in Pokémon maps than 4 - you can see the variety used in Pallet Town above - so we'll have to look deeper.
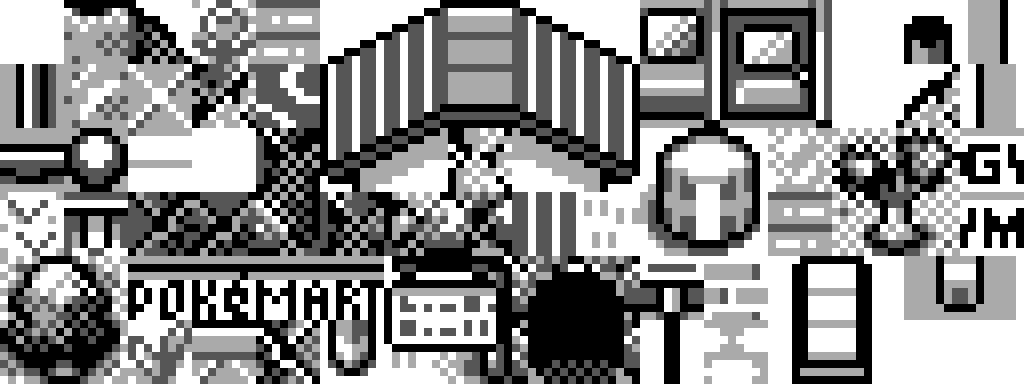
A Look at Tilesets
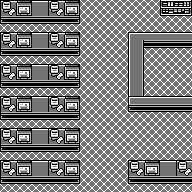
The pokered repository also contains a directory of tilesets, which is our first clue about how this system works. These are stored in gfx/tilesets. Each tileset is represented twice - a jpeg image and a 2bpp file. There are 19 of these tilesets for use cases like "house", "gym", "forest", and "overworld". Here's what overworld.jpeg looks like:
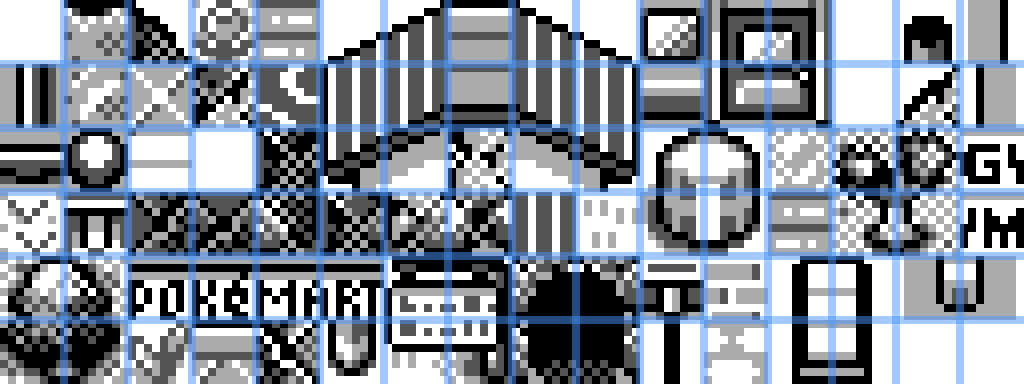
In the game, you move the player character around a grid of squares. These tilesets are not stored in squares. Notice that each 8x8 pixel tile measures exactly half the width and height of an in-game 16x16 pixel square. Here's a version of the tileset above where I've drawn dividers between the tiles:
For example, the infamous log (pillar? column?) that borders in-game areas is spread across 4 tiles. To save space and increase possibilities, each in-game square is made up of 4 tiles in a grid. This allows for creative combination of them to make more interesting maps.
The 2bpp file is what's actually compiled into the game. This represents our tileset image data, which is stored in "2 bits per pixel" format. This matches the color support of the original GameBoy which can only support 4 shades of gray. These are stored as 00 for white, 01 for light-gray, 10 for dark-gray, and 11 for black. These pixels are packed in 64 pixel tiles, and they are represented in a top-left coordinate system. This means the first pixel read is at (0, 0) at the top left of the tile, and the last pixel read is at (7, 7) at the bottom right of the tile.
Unusually, these tile pixels are spread across bytes. So these two bytes:
00000000 11111111
would not lead to pixels of 00 00 00 00 11 11 11 11. Instead, you'd take each bit in the first byte and combine it with the bit at its same index in the next byte. This example would yield 01 01 01 01 01 01 01 01. This is counter-intuitive but essential to parsing the tilesets.
Because it's in the overworld, Pallet Town uses the overworld tileset. You can find this information in Pallet Town's header file in data/maps/headers/PalletTown.asm which lists it as OVERWORLD:
map_header PalletTown, PALLET_TOWN, OVERWORLD, NORTH | SOUTH
Blocksets to the Rescue
We still don't have nearly enough information to reconstitute a map. I got stuck here for a while. The bytes from the map blk files can't be offsets into the tileset - they're not big enough to store that data. There must be something else.
I grep'd around in the pokered repository looking for what could be missing. I found a file that held the key to understanding how these maps are stored - the blockset.
These blockset files live in the gfx/blocksets directory. Each tileset has its own blockset. For example, the overworld tileset has its own overworld.bst file in this directory. These are essential for properly parsing the map.
Because the GameBoy is so resource constrained, the game reduces common tile combinations into "blocksets" (also sometimes called "metatiles" in the map editing community). A blockset file contains "blocks" - 4x4 tile combinations that are used in-game. Each block contains 16 bytes, where each one is an offset into the tiles from the 2bpp tileset. These are also stored with a top-left coordinate system, and are stored contiguously - block-by-block - and referenced by index.
Putting it Together
For me, figuring out blocksets was the missing link for understanding the end-to-end flow. We said earlier that our map, Pallet Town, measured 90 bytes despite being 20 squares wide by 18 squares tall. This is because map bytes are block references. So Pallet Town measures 10 blocks wide by 9 blocks tall. You can find these dimensions inside of the constants/map_constants.asm file, where they are represented as height, width for each map:
mapconst PALLET_TOWN, 9, 10 ; $00
Putting these parts together:
Find its tileset in its header (stored at data/maps/headers/
Read the tileset in as a 2 bits per pixel format file. Pixels are spread across neighboring bytes. Tiles are stored as 8x8 pixels, and read in from top-left to bottom-right. A square is represented by 2x2 tiles
Read in the blockset, 16 bytes at a time. Each 16 byte unit is a block. These blocks measure 4x4 tiles - each byte is an index into the tileset read above. Blocksets are also read from top-left to bottom-right. Blocks measure 2x2 squares
Read in the map file. Each byte in the map file is an index into the blockset for the block to show at that location. Maps are also read from top-left to bottom-right
Rendering Maps
While working through this, I wrote a small program to follow the above steps and print out maps to STDOUT. Because there's no Unicode character for white / light gray / dark gray / black, I used some emoji (⬜ / 🔳 / 🔲 / ⬛) to achieve a similar look.
Here's my program rendering Pallet Town with these emoji:
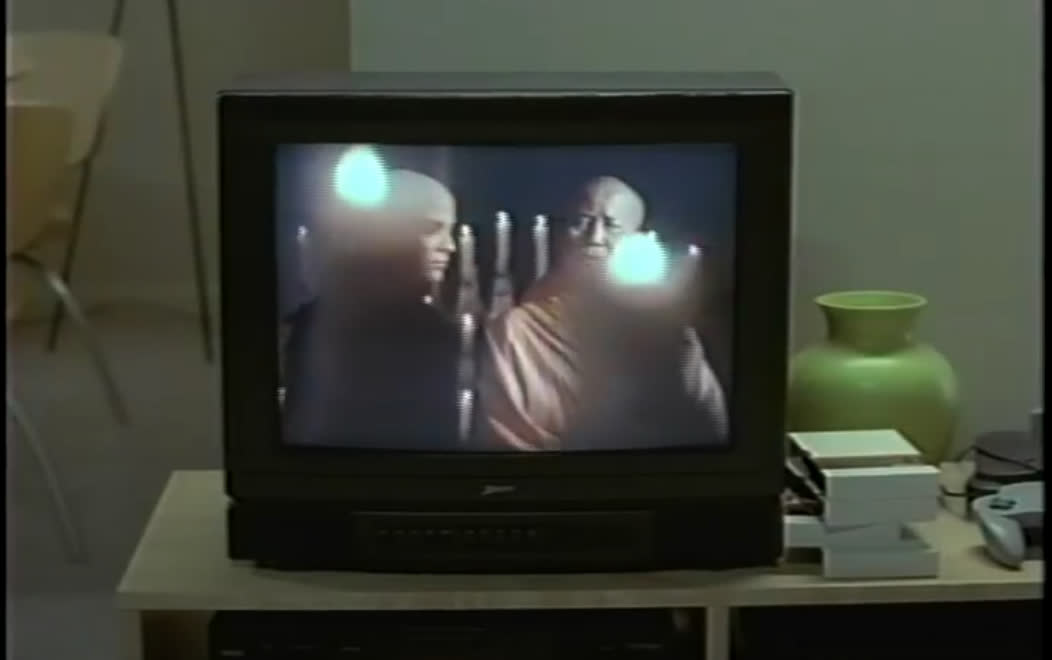
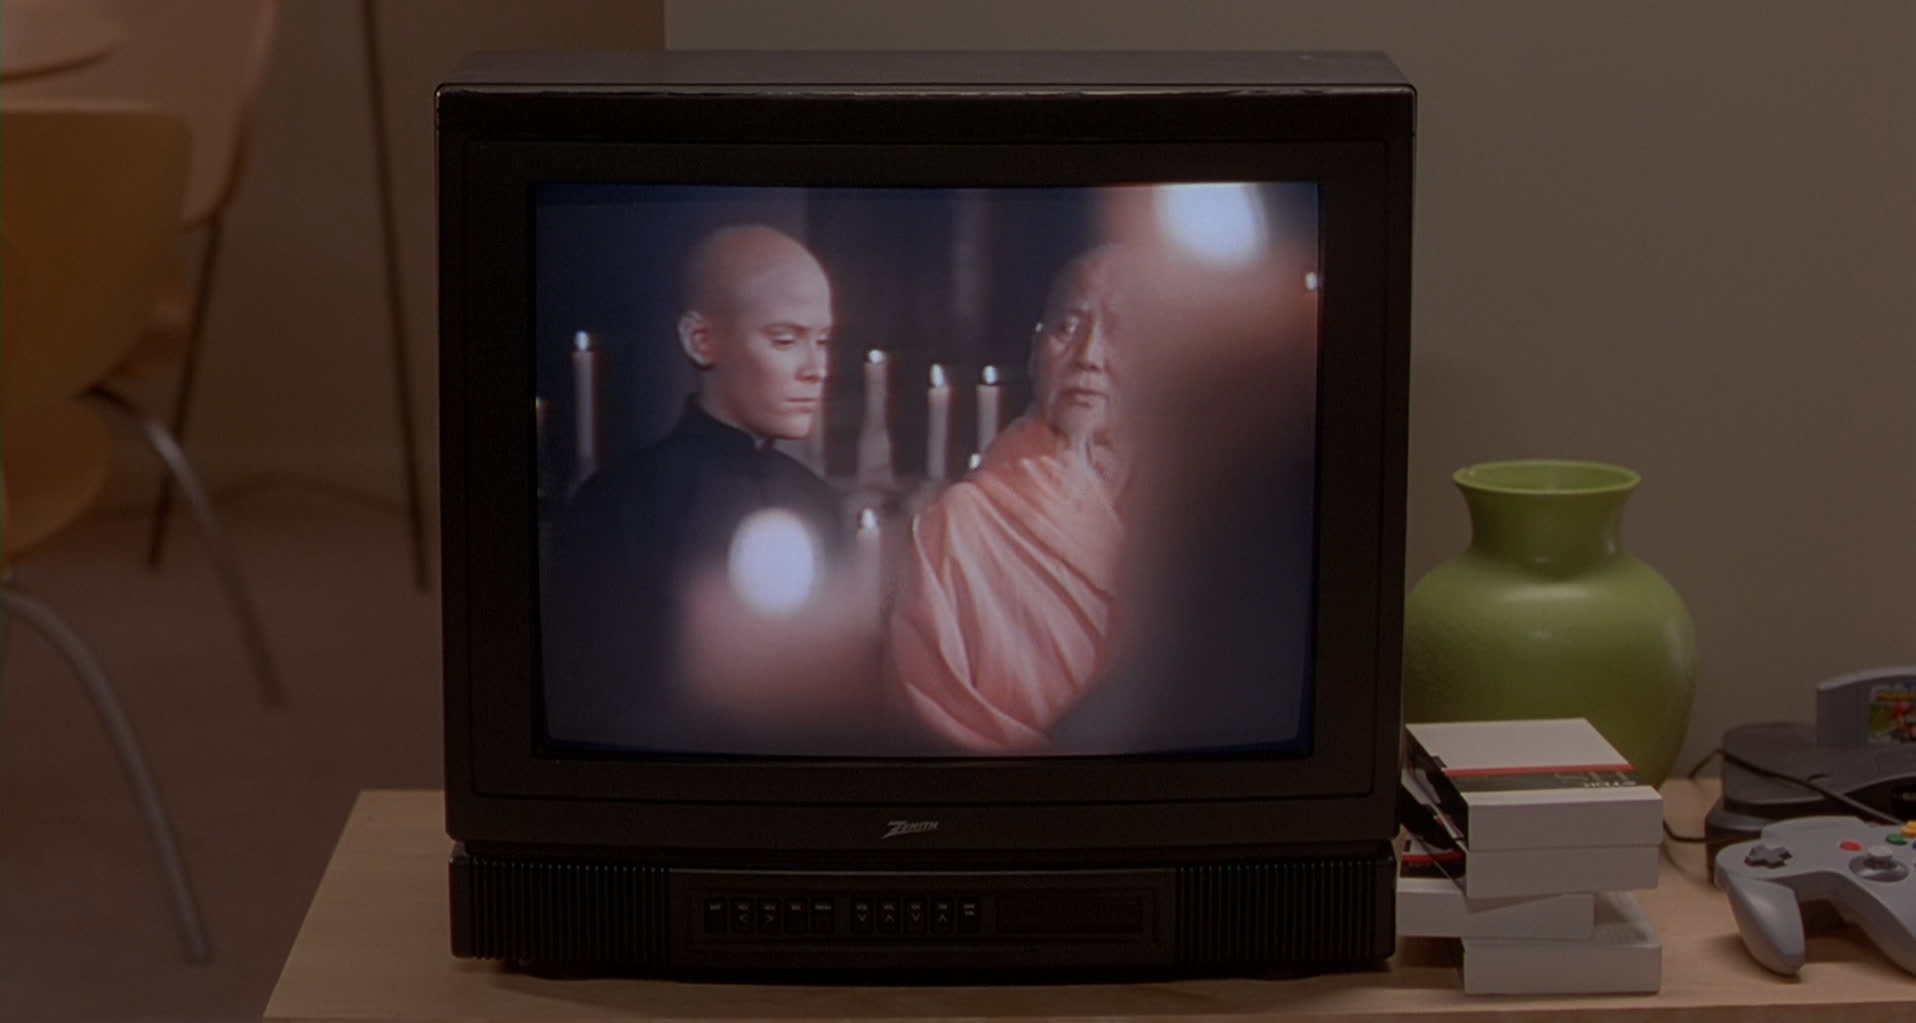
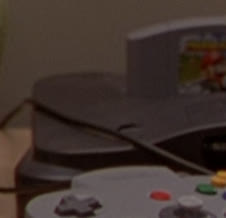
There's something interesting in this montage, around the 1:04 mark. Near the right side of the screen:
It's a Nintendo 64!
Right at the edge of the frame is part of a cartridge. Because of cropping, we can't tell what game is in the console in the standard-definition version of the film.
I love Pokémon. My fascination with the series began with the original games released in the US, Pokémon Red and Blue (I had the Blue version).
In the past few years, people have been disassembling Pokémon games. You can check these out for Pokémon Red and Blue, Crystal, Emerald, and others. It's really cool to be able to compile and build a game that was such a huge part of my youth.
I thought it would be fun to play with this source code, viewing these games through a new lens. A few months ago, I discovered Graphviz, a software package for rendering graphs written in the Dot language. Dot is a very simple language, and it's easy to filter data into its format. Graphviz includes some command line tools that can render dot files to nice human-readable output. Let's see how we can use Graphviz to visualize Pokémon Red and Blue.
Inside of pokered, there's a data directory with a mapHeaders subdirectory inside. mapHeaders includes metadata about every overworld map in the game. This includes the connections between maps. For example, here is the metadata for Route 10:
$ cat Route10.asm
Route10_h:
    db OVERWORLD ; tileset
    db ROUTE_10_HEIGHT, ROUTE_10_WIDTH ; dimensions (y, x)
    dw Route10_Blocks ; blocks
    dw Route10_TextPointers ; texts
    dw Route10_Script ; scripts
    db SOUTH | WEST ; connections
    SOUTH_MAP_CONNECTION ROUTE_10, LAVENDER_TOWN, 0, 0, LavenderTown_Blocks
    WEST_MAP_CONNECTION ROUTE_10, ROUTE_9, 0, 0, Route9_Blocks
    dw Route10_Object ; objects
So south of Route 10 is Lavender Town, and west is Route 9. We can use this connection data and some simple uses of grep and awk to generate Dot code representing these connections. The following commands are all run from /data/mapHeaders in the pokered repository. First, we use grep to see the connections:
Undirected Dot edges are represented with the two nodes and a -- between them.
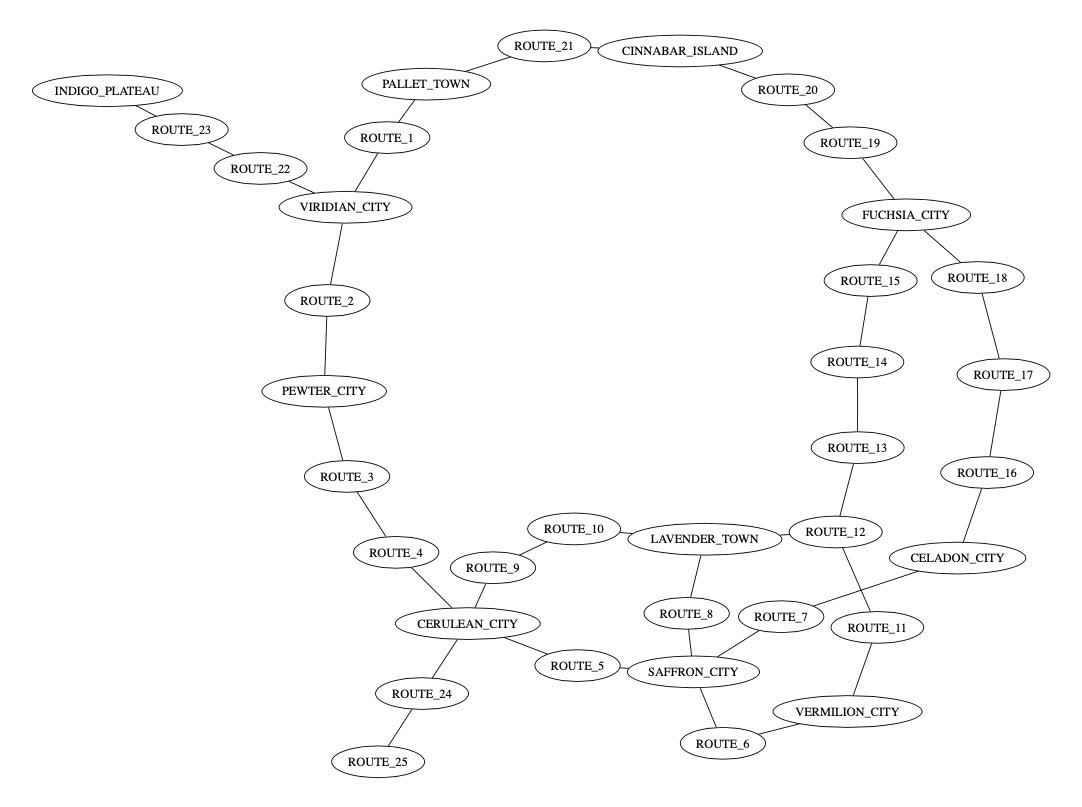
We can represent a strict (one connection between nodes) graph (non-directed, as these are bidirectional connections) by wrapping all these connections in a strict graph {}:
We can add two other options (overlap=false to avoid edge overlap and splines=true to use splines for edges) to get a better looking graph. Here's my pokemon_rb_towns_and_routes.dot generated from the above steps:
OK, so towns and routes are cool. Can we augment this file to include buildings, tunnels, and rooms? There are warp and warp_to markers in the files in /data/mapObjects. For example, let's look at SaffronCity.asm:
(These _WIDTH suffixes seem to indicate the coordinates are inside of the width of the map. We'll clean them up later.)
So, if we parse out the warp_to statements, we should be able to get a more complete view of the game's locations and how they connect. Let's start with a simple grep to find all the warp_to statements (run from /data/mapObjects):
This is close, but includes some warps that appear to point to themselves (like BIKE_SHOP_WIDTH above). No problem - we can only print lines with ; in them using grep:
(note the leading space here - not a big deal for the Graphviz tools)
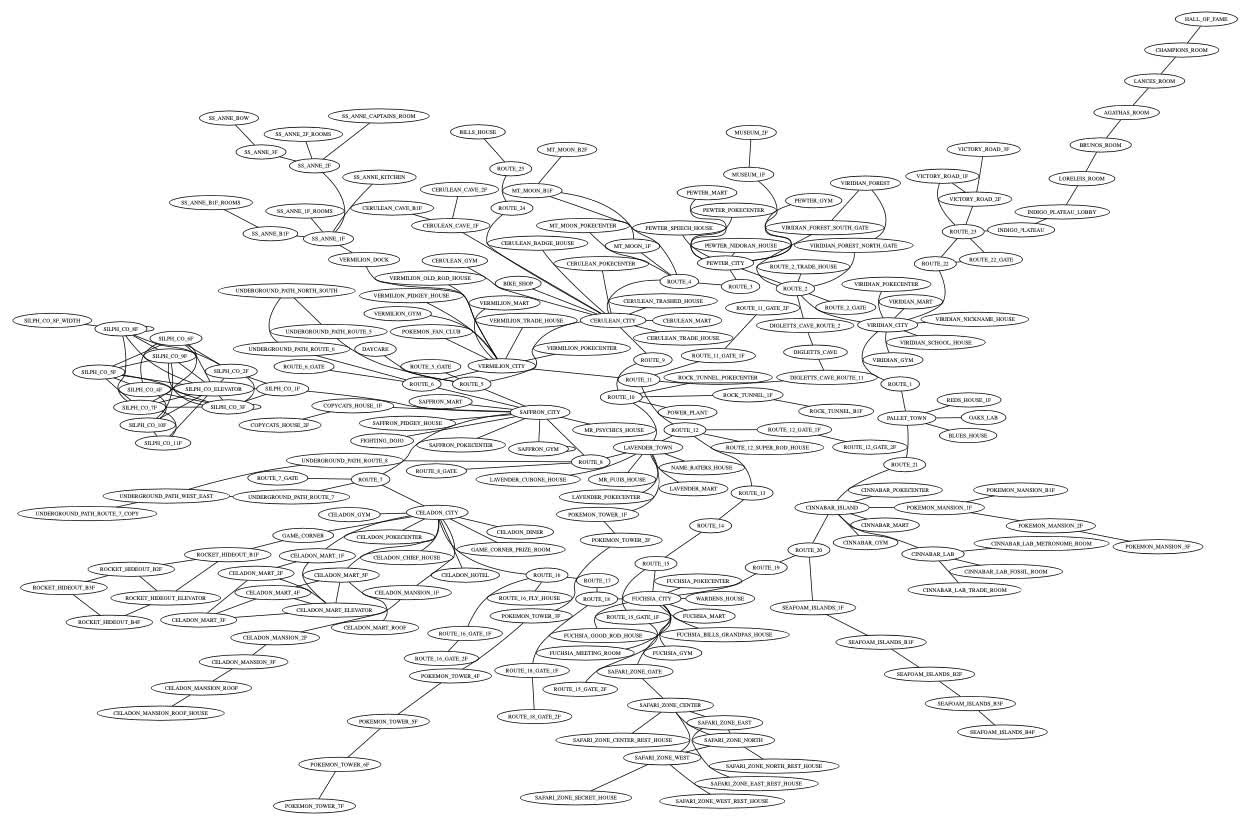
Now, we'll put this all into a pokemon_rb_all.dot file (along with the connections from pokemon_rb_towns_and_routes.dot) to make a graph of all of the locations in Pokémon Red and Blue. For this invocation, I also used neato:
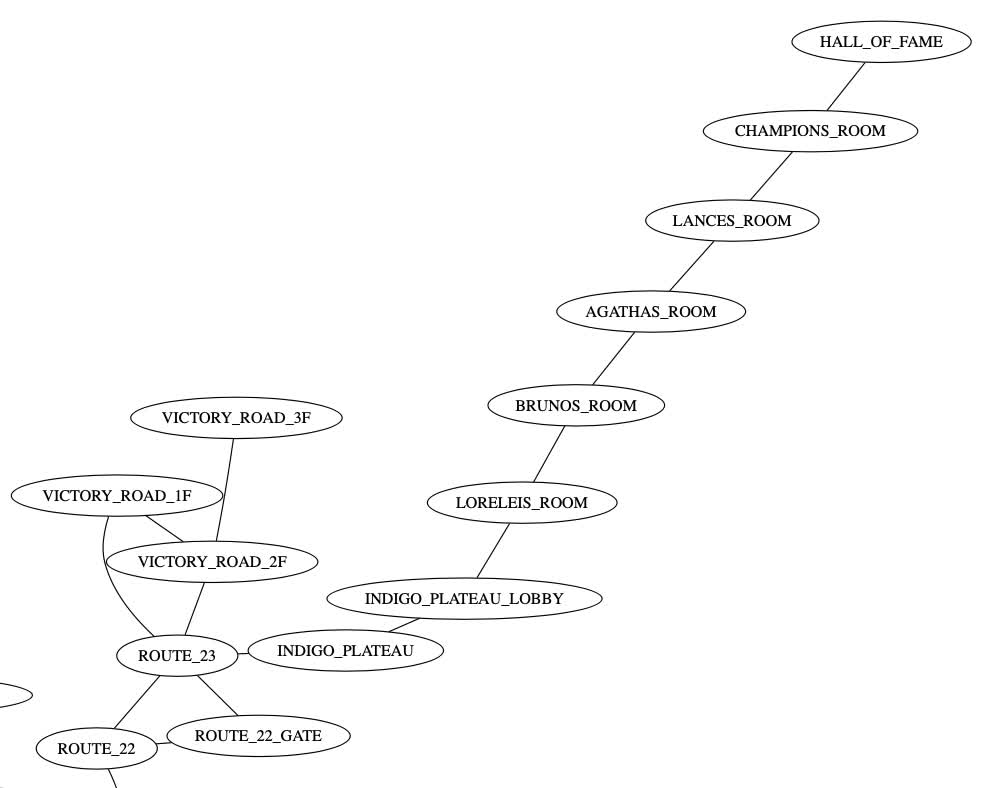
There are so many sections of this graph with interesting details, like Victory Road leading into the Indigo Plateau and Elite Four:
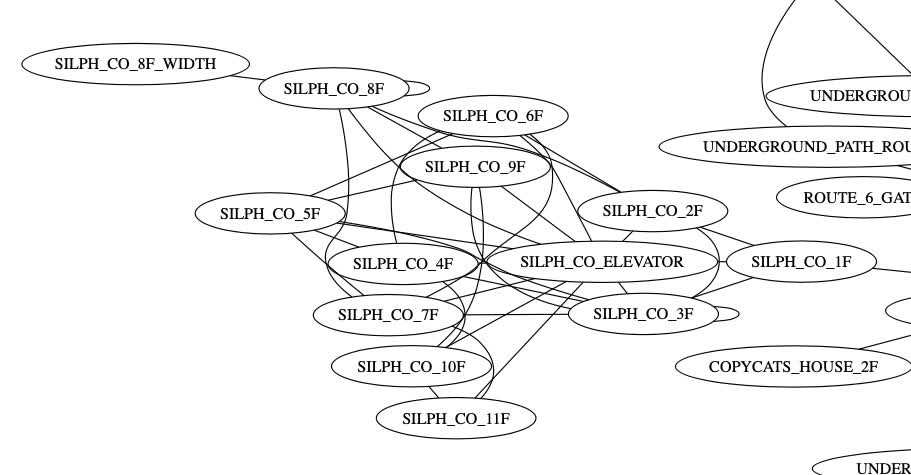
Or the maze-like Silph Company building:
I think it's really cool how easy it is to use simple tools to see these games from a new angle. I hope to look at other aspects of these games sometime in the future.
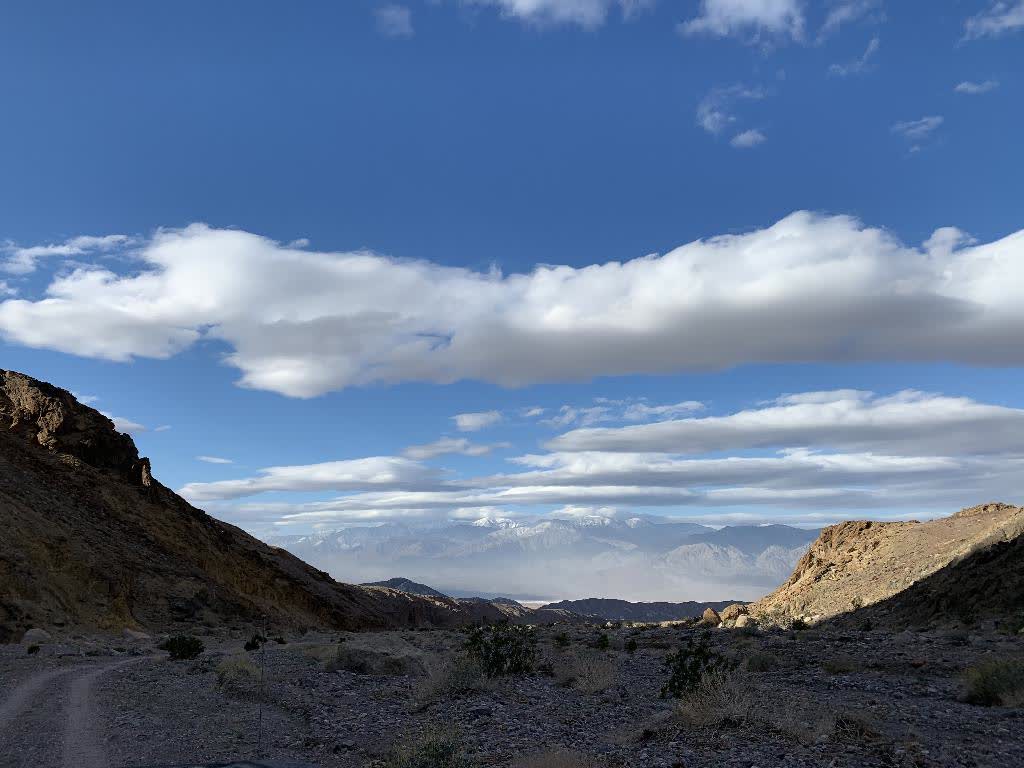
In February, I had the opportunity to go on a trip to Death Valley National Park with some friends. It was an awesome time! Here’s what happened:
Gear
I was lucky enough to go to REI with one of my buddies, a camping veteran, before the trip. He was also the organizer of our trip to Death Valley. At REI, I secured some supplies, including essentials (sleeping bag, freeze-dried food), things I thought were unnecessary but ended up being very useful (utensils, sleeping pad), and things I had no idea you needed or wanted on a camping trip (pillow, chair). It helps to go with people who are experienced!
The Trip Out
We left at an early 5AM towards our destination. The Death Valley area is a good 6-7 hours from the Bay Area. The drive was pretty, complete with an early morning coffee pit stop in Gilroy. Onwards...
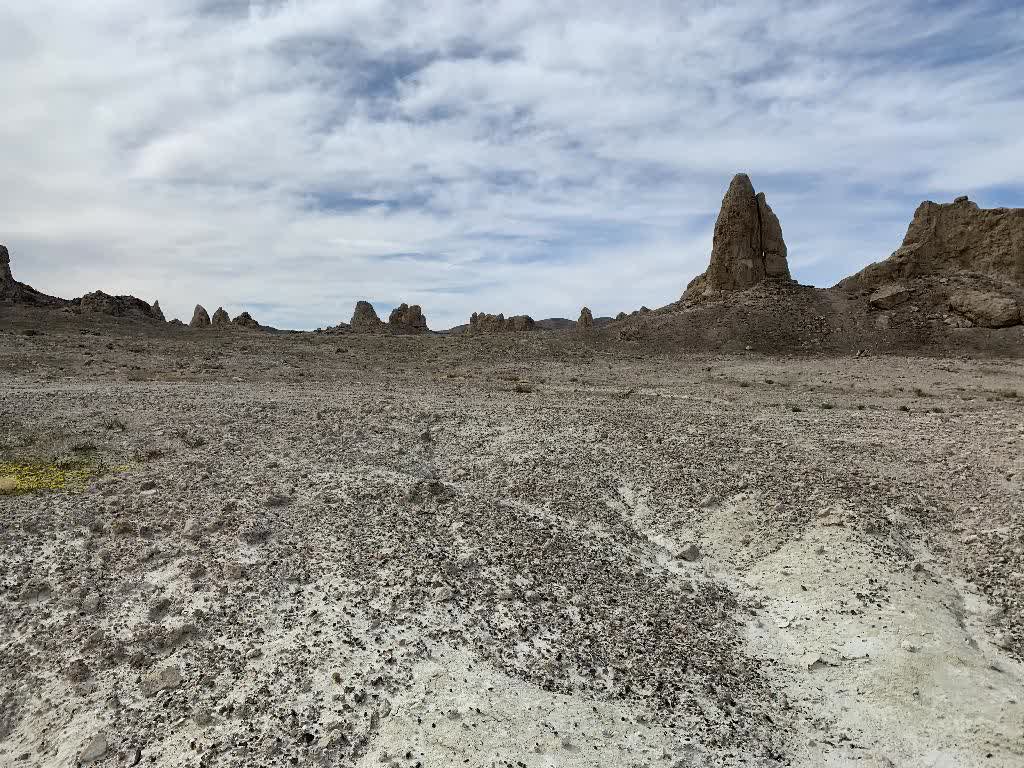
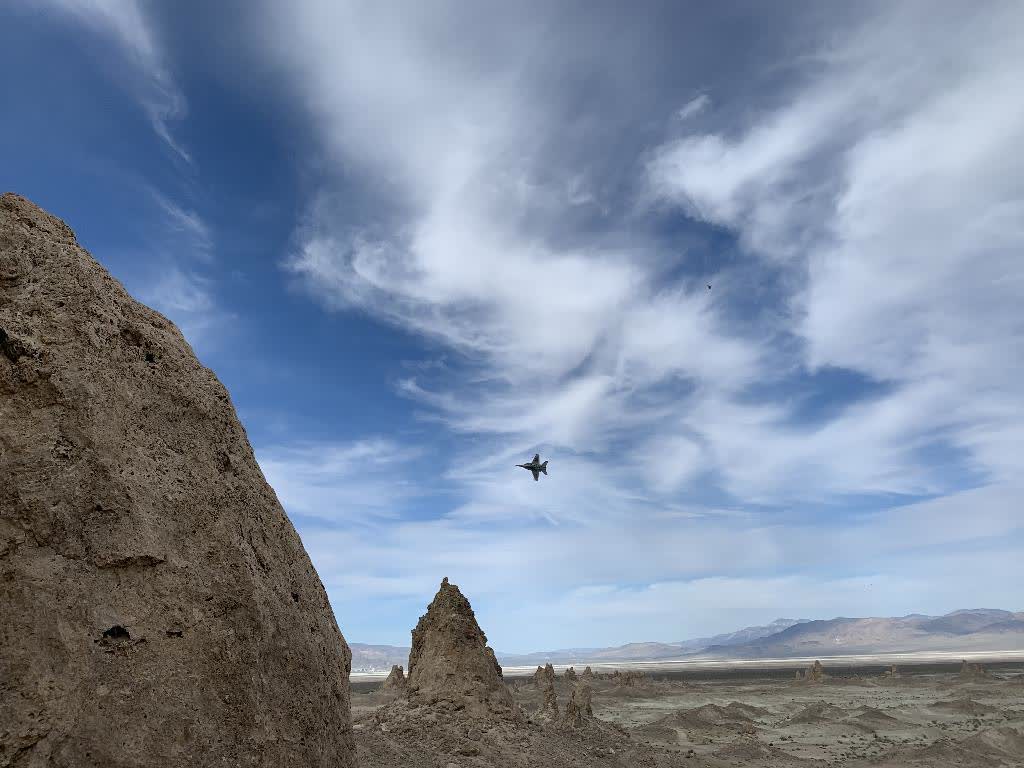
Campsite One: The Trona Pinnacles
We arrived in our first campsite: the Trona Pinnacles. This area looks like another planet:
In fact, it’s been used for just that in movie and TV sets (Star Trek V was filmed here). It was also the setting for Lady Gaga’s latest video.
This is also where fighter jets do test flights, which is really cool to see up close:
The area is part of California’s BLM lands. This made it a great spot for camping and for a fire.
Along with some Ardbeg, I enjoyed some a delicious freeze dried meal: chili macaroni and cheese with beef.
Campsite Two: In The Park
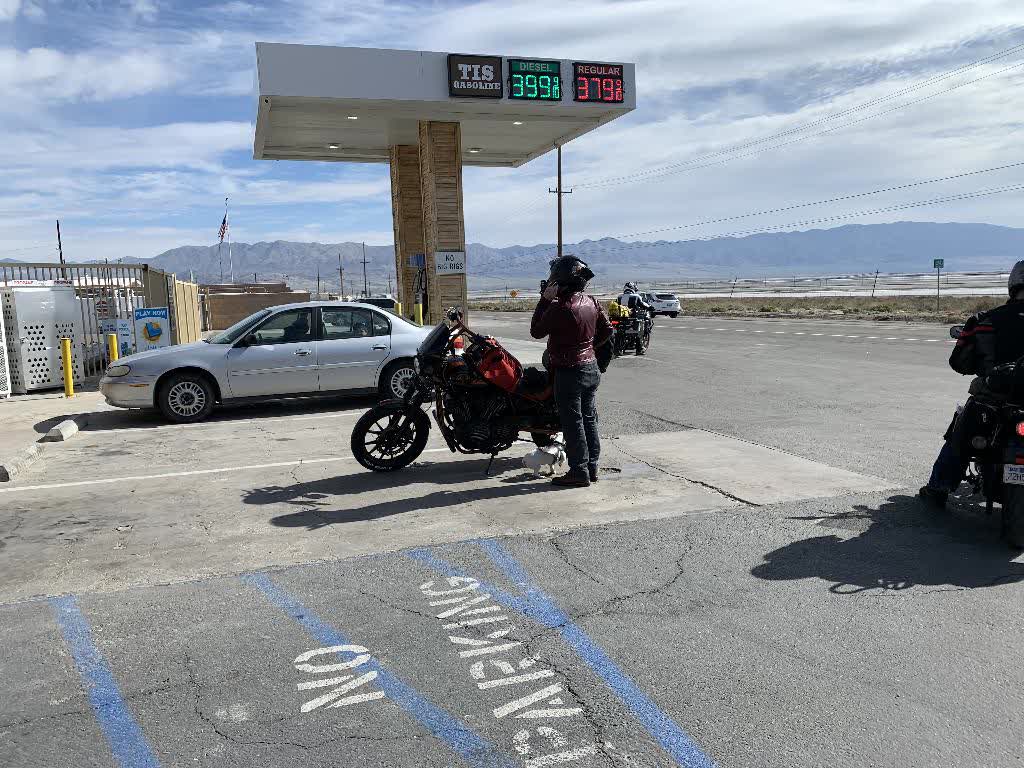
After a nice oatmeal and some instant coffee, we pushed off to Trona, CA to stock up on some snacks and get gas. Trona is an industrial town in the middle of nowhere. My fiancé and I fell in love with it on our first visit. They mine borax and salt. I love this note from the Trona High School Wikipedia page:
Until several years ago an annual game was played against Boron High School. Referred to as the Borax Bowl by some, the game was a matchup of two mining towns that are world leaders in producing potash and borax, minerals used in a number of products.
While in Trona, we saw a motorcycle group with a dog that rode along. Cool!
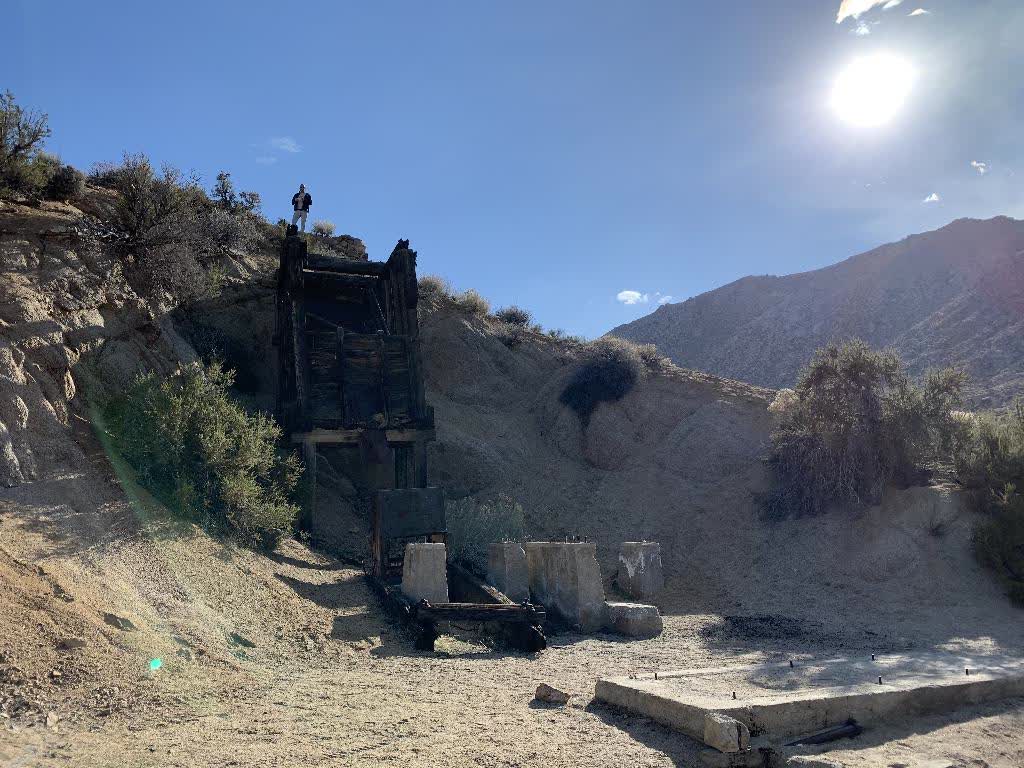
We took off to enter Death Valley. Rather than entering through the visitor center from California, we took a side route. We saw some amazing sites on the way in to the park:
I even saw an abandoned mineshaft - cool!
We then arrived at our next camp site. We set up our tents, and imbibed and ate.
The night was a bit windy, but the tent I was loaned stood up just fine after some rocks were placed inside.
Campsite Three: Echo Canyon
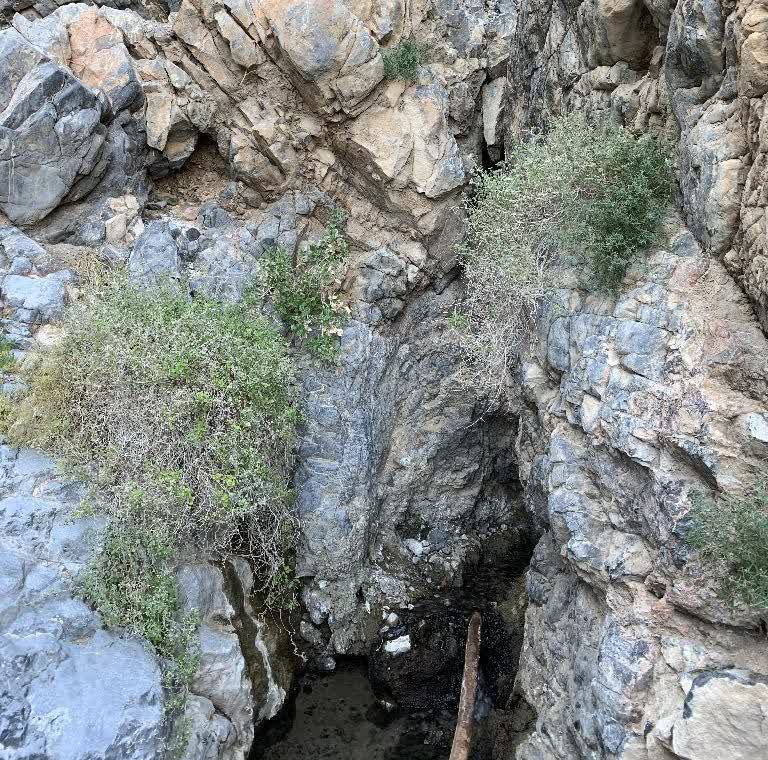
We awoke, had some breakfast, and pushed off. We stopped off at some abandoned campgrounds and checked out a cool natural spring:
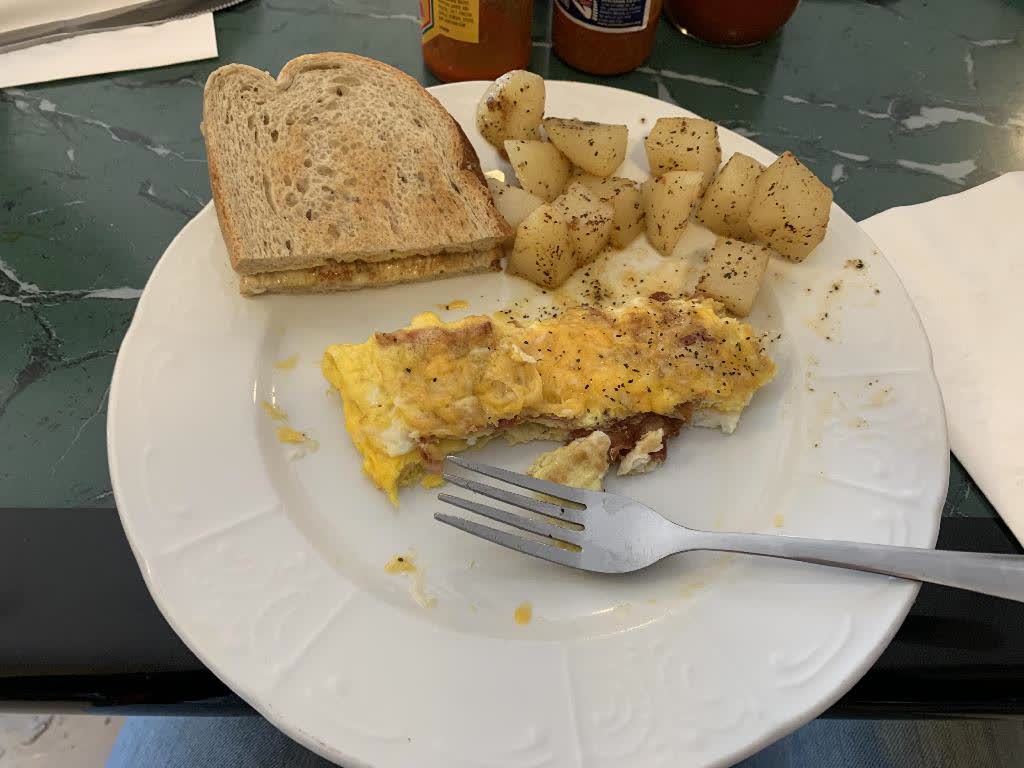
We headed off to Beatty, NV for a stop at a diner:
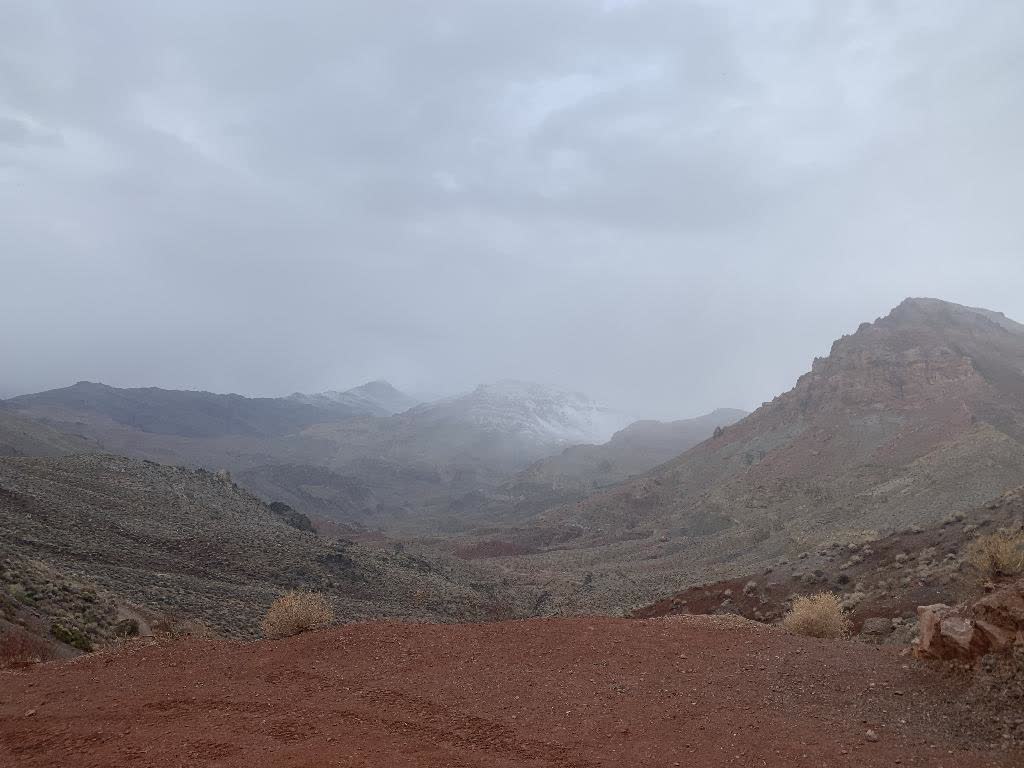
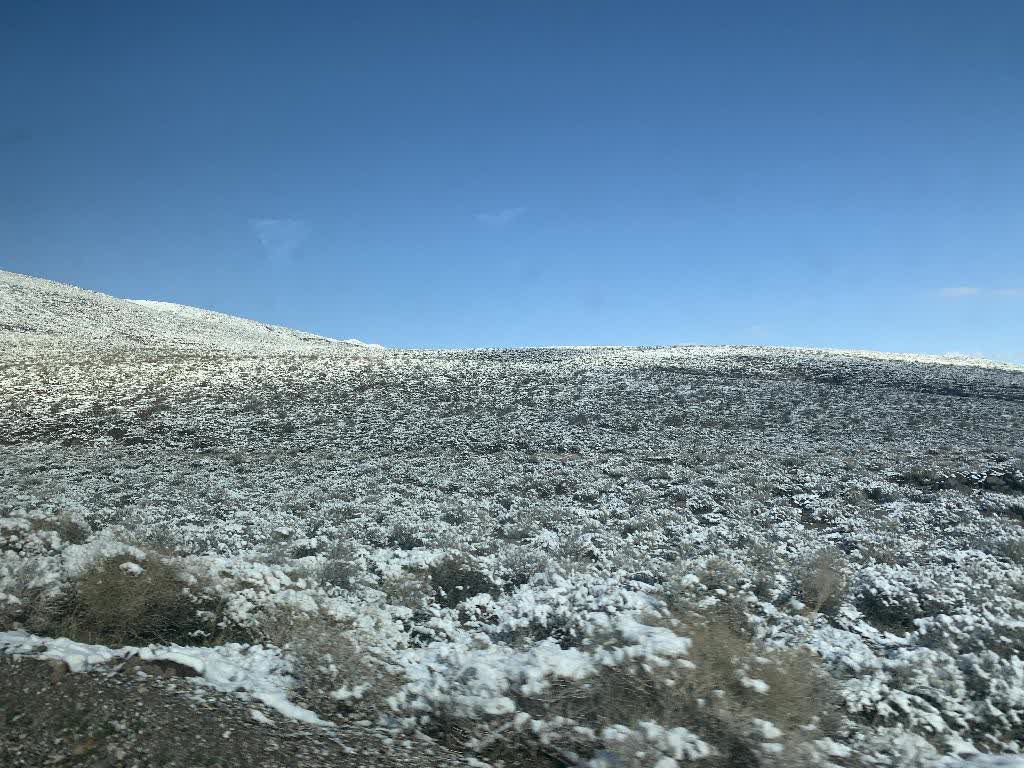
We had to make a game-time decision about where to stay on this third night. We had thought of staying that night in a canyon, but the park was experiencing snow (in a desert no less):
I was really hoping we would not have to call off our trip a day early. We decided to stay the night - I was happy we did - and headed off to Echo Canyon.
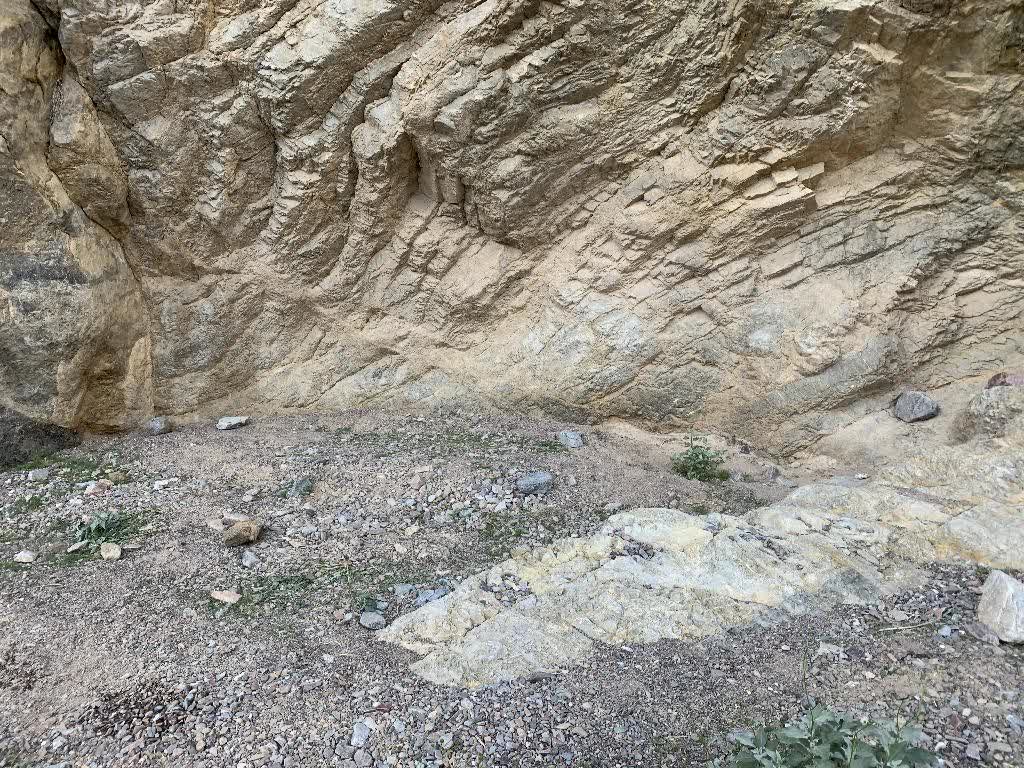
Inside the canyon, we found a nice campsite against some rocks:
We pitched our tents, and had dinner for the evening.
As the night wore on, the wind picked up more and more. I awoke at around 4 in the morning to the wall of the tent covering my body, pushed by a strong wind. I figured I wouldn’t suffocate (I was getting barraged by oxygen), so I went back to bed.
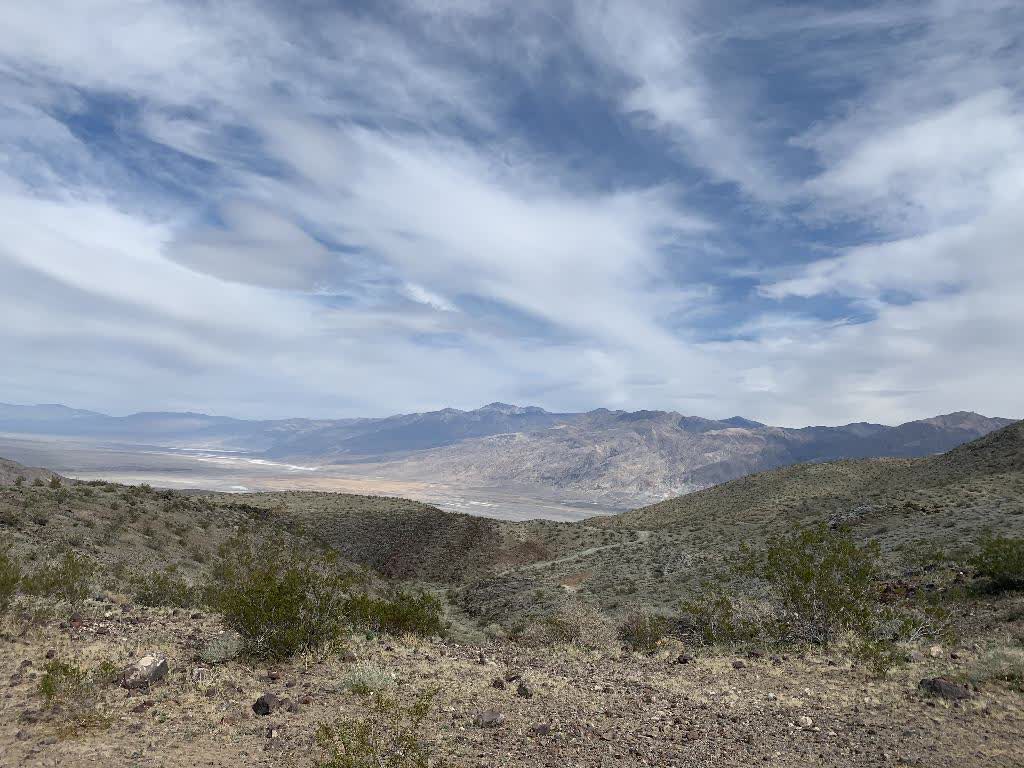
The Trip Back
The next morning, after our customary breakfast, we packed up and headed back to civilization. We saw some beautiful views on our way out:
We stopped at a truck stop for some food. I had a Double Quarter Pounder with Cheese - it was delicious.
All in all, a great trip! I hope to get back soon.
This is the second in the Peterometer series. The first can be found here.
After I felt comfortable tracking hydration, I wanted to introduce other metrics tracking into my life. I've been tracking the food I've eaten since March 2019. With less than a week of downtime, I've tracked everything I've eaten since that time.
I track my food in the LoseIt app. I usually log the food right after eating it, and I really enjoy seeing how many calories I've eaten that day.
In the past year, I've also become really into eating raw eggs. I enjoy them on starchy foods, like ramen or rice. Kind of like my own version of tamago kake gohan. In a given week, I'll end up eating a few meals with raw eggs.
But how many raw eggs? Let's find out!
Exporting LoseIt Data
LoseIt lets you export the food you've eaten on a weekly basis from their website. These export as a CSV file, which is perfect for processing and backup. If you're a Premium member, go to your "Insights" tab on the website and then look for "Weekly Summary" and "Export to spreadsheet". I export my data every 2 or 3 weeks, and collect it all in a folder on my machine. These files are numbered based on their starting day since January 1 2000:
$ ls
WeeklySummary6637.csv
WeeklySummary6644.csv
WeeklySummary6651.csv
WeeklySummary6658.csv
WeeklySummary6665.csv
WeeklySummary6672.csv
WeeklySummary6679.csv
...
Generating a master food CSV
I wrote a simple shell script to combine all these summaries, remove workouts (I track these separately), and then generate a master combine.csv file with all my food in one place:
(this example highlights a problem with my use of sort in the script: 01/01/2020 sorts alphabetically before 12/01/2019)
Analyzing the food I've eaten
We can use some simple utilities to query the file. For example, how many food entries have I logged?
$ cat combine.csv | wc -l
3984
Wow! That's a lot of food. This averages to around 12 entries per day.
We can grep for other data, like how many burritos I've had.
$ cat combine.csv | grep -i burrito | wc -l
38
I've eaten a burrito every 9 days or so.
Counting raw eggs
But how many raw eggs have I eaten? I usually log these when I eat actual raw eggs (when I cook an egg dish on the stove without oil I will also count it as raw eggs). Let's grep the CSV file:
This grep picked up anything with "egg" in the title, like scrambled eggs. We only want to look for raw eggs - it's simple enough to do that by modifying our grep invocation. But keep in mind the header line of combine.csv:
Date,Name,Type,Quantity,...
The fourth column is the quantity. This is how many raw eggs I actually ate. So we really want to sum that column.
(yes, I did eat non-whole portions of eggs some days)
276.75 raw eggs. That's nearly two dozen dozen raw eggs!
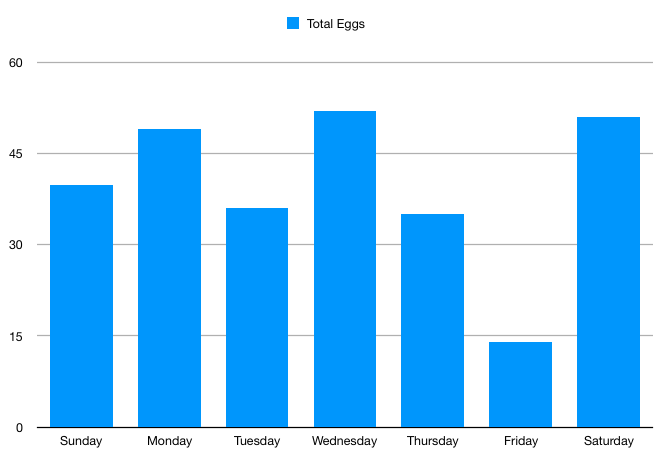
Raw egg consumption based on day of the week
As a fun visualization, I wanted to see if I ate raw eggs more on a particular day of the week. I did this using some simple categorization in Numbers:
Wow! Based on this, I had way fewer raw eggs on Fridays. Tuesdays and Thursdays are lighter weekdays for raw egg consumption.
Looking forward to more food analysis
Counting raw egg was a fun test of the data I've been gathering for the past 10 months. I'm really excited about the other visualizations and analysis I can do on the food that I've eaten.
While the film moved at a slower pace, I found some of Ulillillia's quotes from it interesting. In the documentary, Ulillillia lives with his parents:
There's very little I can do, so I don't get much enjoyment ... I definitely wish I could travel more, or see the world ... it's like I can't get out of the cage
According to this wiki page, he has since gotten a driver's license and moved out of his parent's home to Florida.
I own a Nintendo Switch console. Because I don't want physical games cluttering my home, I get all my games digitally. I recently started running out of room and needed a new SD card to hold my games. This path ended up being circuitous, taking me through fake flash storage, the Switch's file structure, and its operating system's treatment of Unix file attributes.
A new card
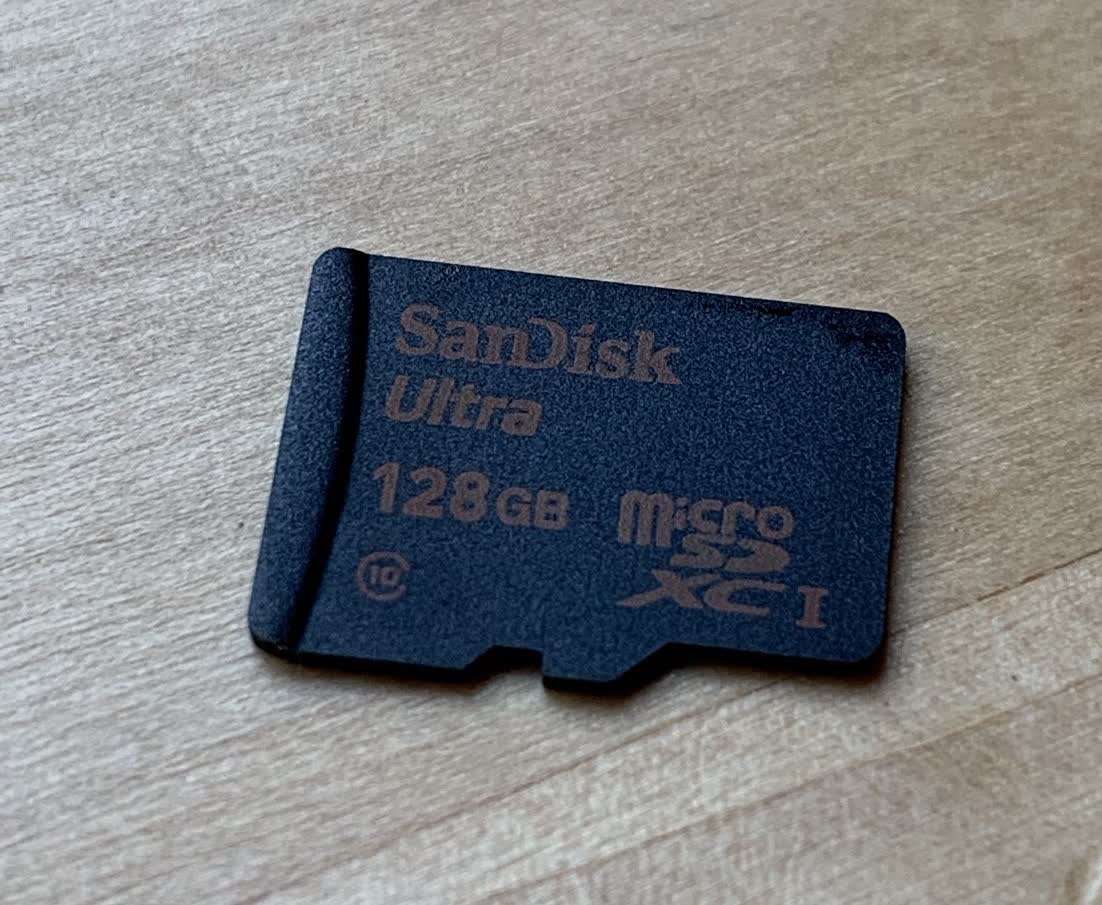
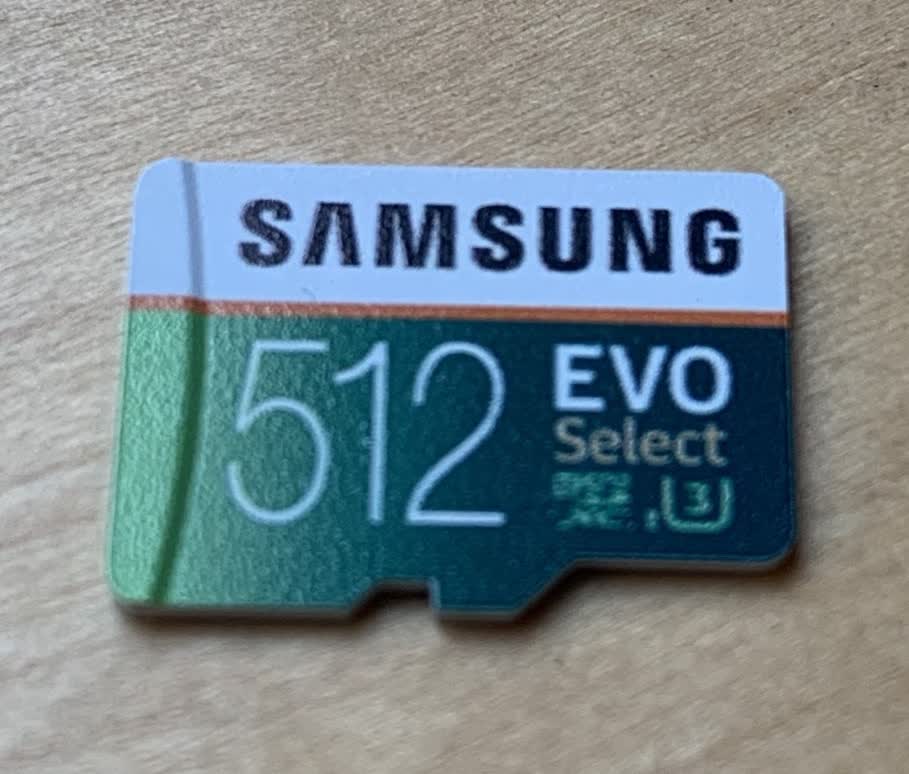
I purchased a Samsung 512GB SD card from Amazon for $65. I'm shocked at how cheap SD cards are now. This replaced my old 128GB card.
Here's the old card:
And here's the new card:
Flash memory has never been more popular. Unfortunately, there has been a recent rise of fake flash memory. These are USB keys, SD cards, and solid state disks that masquerade as a larger capacity, but will lose your data or fail to read / write properly.
After my new card arrived, I wanted to check its authenticity. Is this a real 512GB SD card? Or a fake?
The f3 tool
f3 is a tool to verify the authenticity of flash memory. It stands for "Fight Flash Fraud" or "Fight Fake Flash". From the site:
I started this project when I bought a 32GB microSDHC card for my Android phone back in 2010, and found out that this card always fails when one fills it up.
I installed it on my Mac with brew install f3. This installed two binaries: f3write and f3read.
f3write writes contiguous 1GB files to your card until it has exhausted its space. It will also report on the write speed for this operation. You use it by running it on the path you want to write to. It will report progress when running:
$ f3write /Volumes/test
F3 write 7.2
Copyright (C) 2010 Digirati Internet LTDA.
This is free software; see the source for copying conditions.

Free space: 476.69 GB
Creating file 1.h2w ... OK!
Creating file 2.h2w ... OK!
...
Creating file 476.h2w ... OK!
Creating file 477.h2w ... OK!
Free space: 1.38 MB
Average writing speed: 77.17 MB/s
My card got 77MB/s, which comes out to about 2 hours of write time (this is about how long it felt). After doing the write step, you can run f3read to verify that the files made it there successfully:
$ f3read /Volumes/test
F3 read 7.2
Copyright (C) 2010 Digirati Internet LTDA.
This is free software; see the source for copying conditions.

                  SECTORS      ok/corrupted/changed/overwritten
Validating file 1.h2w ... 2097152/        0/      0/      0
Validating file 2.h2w ... 2097152/        0/      0/      0
...
Validating file 476.h2w ... 2097152/        0/      0/      0
Validating file 477.h2w ... 1432983/        0/      0/      0

  Data OK: 476.68 GB (999677335 sectors)
Data LOST: 0.00 Byte (0 sectors)
           Corrupted: 0.00 Byte (0 sectors)
    Slightly changed: 0.00 Byte (0 sectors)
         Overwritten: 0.00 Byte (0 sectors)
Average reading speed: 71.12 MB/s
This will read each of the 1GB files created by f3write, verifying they did not experience any data loss. This will also report on your card's read speed. Mine was 71MB/s, which also felt like around 2 hours.
Cool, a real SD card that works! Next step: move my games over.
Switch SD file structure
Plugging my old SD card into my machine, diskutil reports an NTFS filesystem:
$ diskutil list
/dev/disk3 (external, physical):
   #:                       TYPE NAME                    SIZE       IDENTIFIER
   0:     FDisk_partition_scheme                        *127.9 GB   disk3
   1:               Windows_NTFS                         127.8 GB   disk3s1
The hierarchy on the card (named "Untitled") has a single "Nintendo" folder on it. What's in there?
$ tree Nintendo
Nintendo/
├── Album
│   ├── 2017
│   ├── 2018
│   └── 2019
├── Contents
│   ├── placehld
│   ├── private
│   ├── private1
│   └── registered
├── save
└── saveMeta

829 directories, 688 files
(heavily truncated)
So, it looks like:
- Album, which includes all my screenshots and video recordings arranged by year
- Content, which has some subdirectories:
- placehld, which has some empty directories - likely placeholders given the filename
- private, a 16B file which looks like it contains a key
- private1, a 32B file which looks like it contains a different key
- registered, which appears to contain all the games
I've used the majority of the card's 128GB space:
$ du -skh /Volumes/Untitled
111G    /Volumes/Untitled
Formatting the card
Next step was to insert the 512GB card into the Switch and ask it to format. This process took about 3 seconds, then the console rebooted itself. I verified that the card was now NTFS:
$ diskutil list
/dev/disk3 (external, physical):
   #:                       TYPE NAME                    SIZE       IDENTIFIER
   0:     FDisk_partition_scheme                        *512.1 GB   disk3
   1:               Windows_NTFS                         512.0 GB   disk3s1
Backing up the card
I don't have two SD card slots on my machine, so I'll need to copy the data first to my computer, then onto the card. We can use rsync to do this:
I used rsync in archive mode by passing the -a flag, which according to man rsync will:
...ensure that symbolic links, devices, attributes, permissions, ownerships, etc. are preserved...
Perfect! I also passed -v for verbose, and -z to use compression as the files are moved.
Restoring to the new card
Now it's time to restore to the new card. After unmounting the smaller card and inserting the new card, it's a simple matter of rsyncing the files back:
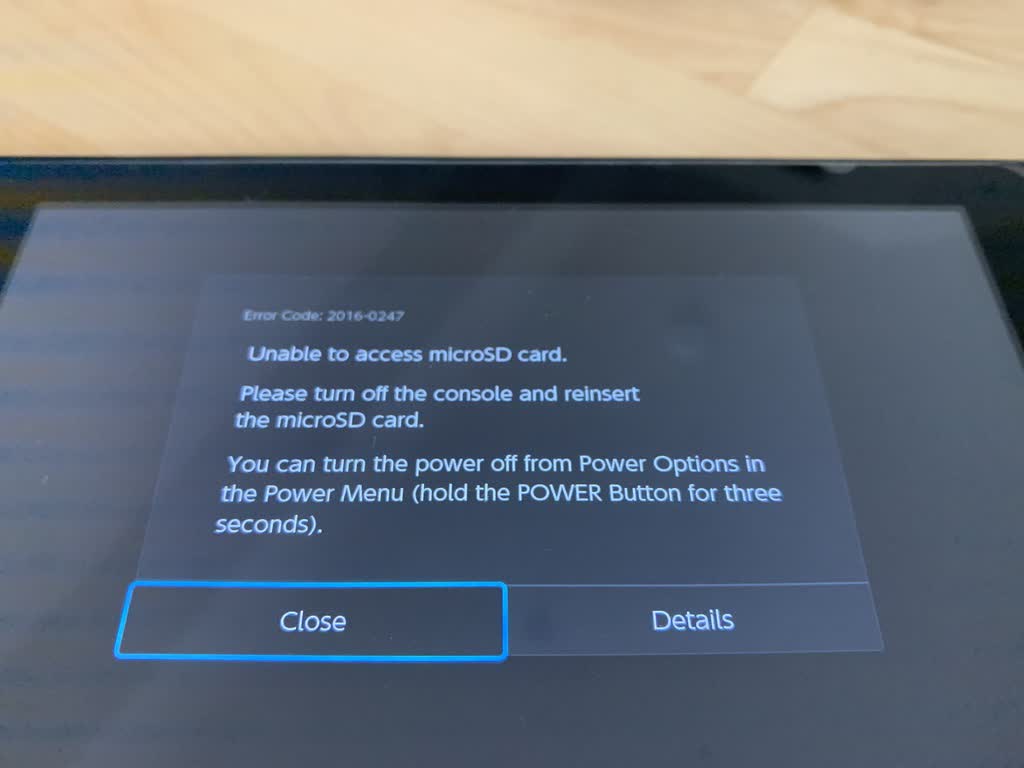
With the rsync step done, we can test out the card:
It doesn't work! The Switch responds with error 2016-0247 and is unable to access the card
I then tried copying the contents of nintendo_backup over the rsync'd backup files with Finder. Perhaps the rsync step missed something? Or my machine fell asleep?
Nope, same error. I tried the original card to verify my Switch was still functional. The original card works fine.
Debugging the issue
So, we've got a new SD card that the Switch won't see:
it was formatted by the Switch's software, so any secret partitions or files should be there
it contains an rsync archive copy of the games and media from the original card
the Switch read the card successfully when formatting it, but hasn't since the restore succeeded
Open Windows Explorer (for PC) and access the microSD card.
Highlight the data and drag it to the desktop.
If you are moving your content to a new microSD card, be sure to first format the new card per our recommendations.
Once the new card has been formatted, continue with the instructions below.
Eject the first microSD card, then insert the second microSD card into the slot or reader/writer.
Using Windows Explorer access the microSD card again.
Drag the data from the desktop to the new microSD card, then insert the new microSD card into the Nintendo Switch console.
Although it does contain this strange warning:
Important: This process may not be able to copy the microSD card contents correctly in environments other than Windows (such as Mac).
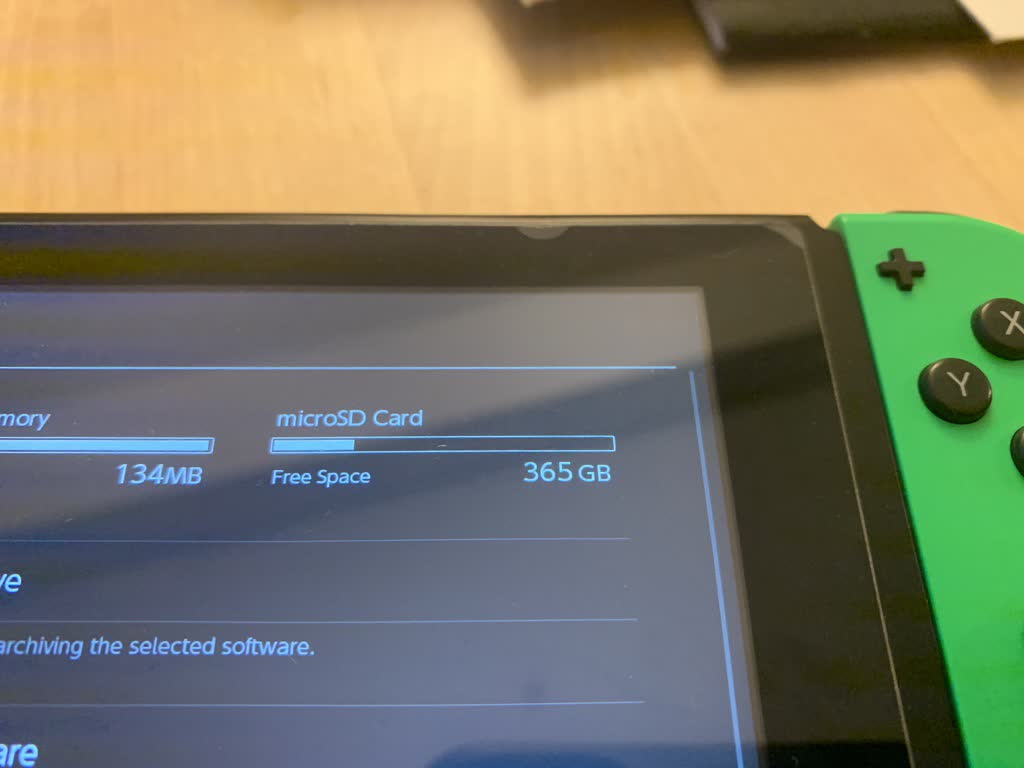
A fix
Turns out I was missing the archive attribute on the card. Simply running sudo chflags -R arch /Volumes/Untitled to fix up the Archive attribute fixed the issue (I also did a sudo dot_clean -mn on the directory). Phew! Look at all that space:
Why did this break?
I'm not totally sure. My hunch is that an archive attribute on the files was confusing the Switch's SD card parsing. It looks like the Nintendo Switch's OS is not Unix-derived, but rather an evolution of the 3DS OS. It's possible that some file attributes from Unix may have confused the Switch.
This is the first in a series of posts I hope to write about building tools for "Peterometer", a way to visualize stats I've collected about myself.
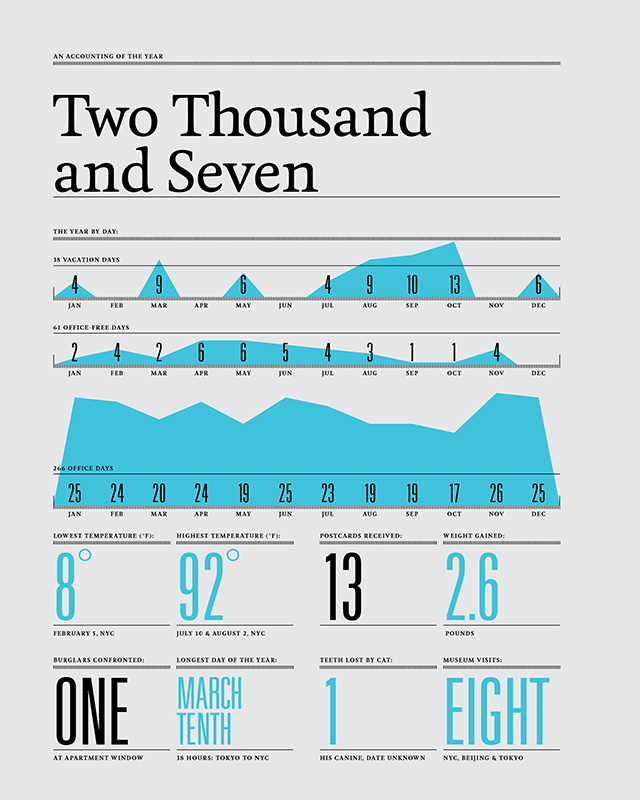
Inspiration for Peterometer
I've long been inspired by people who build beautiful visualizations of their gathered metrics. For example, Nicholas Felton's annual reports. Here is an example from his 2007 report:
He has some great posts about his creative process here and here. The Iron Man-style HUD influence shines through in the finished product.
These visualizations are really cool ways to show stats gathered about your life. I've recently been getting more into tracking my day-to-day life, and experimenting with visualization techniques to showcase this data.
Hydration Tracking
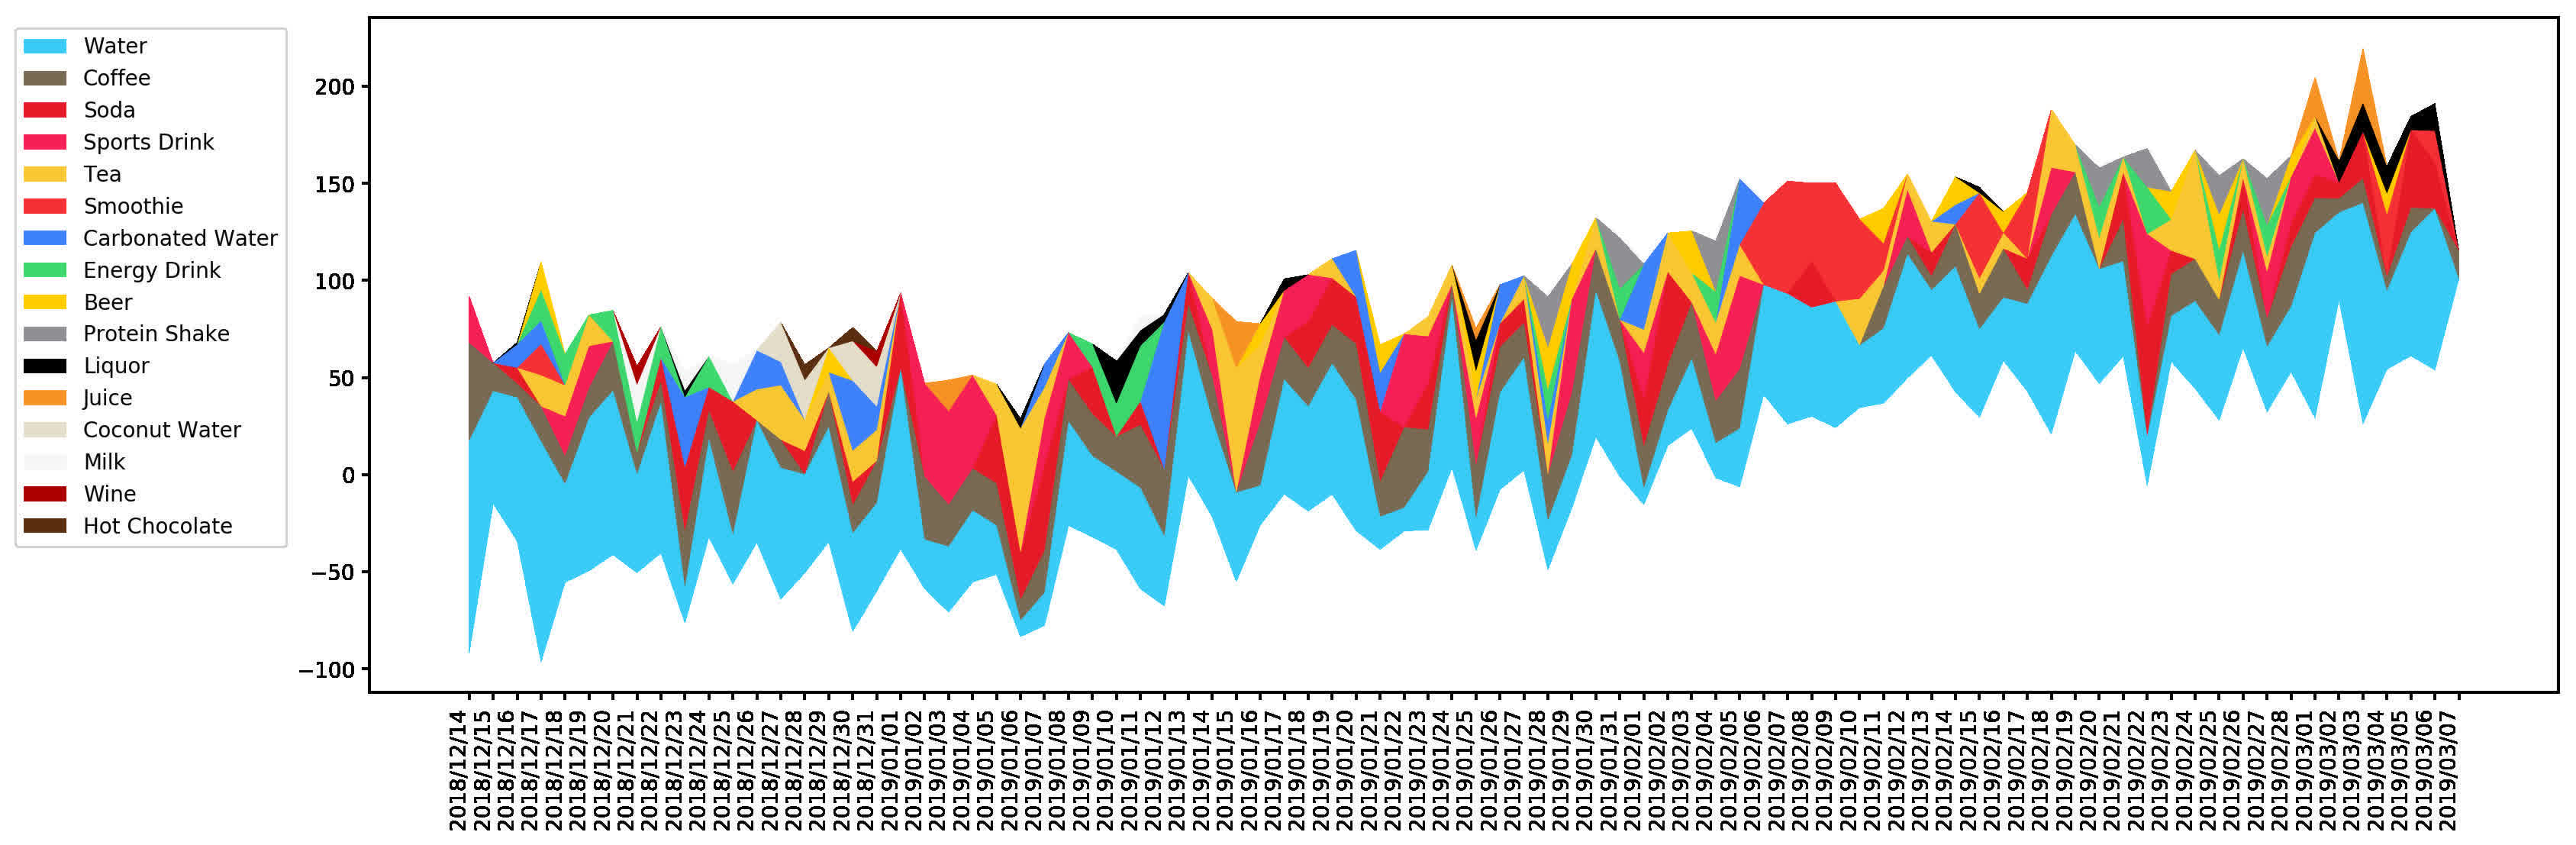
Since December 2018, I've been tracking my hydration every day. Every time I finish drinking something, I log the type of drink it was, and how much of it I drank. I log the data using the WaterMinder app on my watch and phone. WaterMinder lets you have saved drinks, which is really helpful if you drink the same thing often (my Nalgene, a cup of coffee from the machine at work, etc.)
This chart is a bit tough to read due to data density. The legend is sorted in descending order of consumption. By the numbers, this is:
Drink
fluid oz.
Water
4159.7
Coffee
1482.7
Soda
826.9
Sports Drink
761.9
Tea
751.4
Smoothie
398.0
Carbonated Water
381.4
Energy Drink
273.6
Beer
225.0
Protein Shake
162.0
Liquor
130.0
Juice
94.0
Coconut Water
81.6
Milk
55.1
Wine
17.6
Hot Chocolate
15.0
Total
9815.9
Using the chart and table there are some interesting takeaways:
- I drink a lot of coffee. Almost 44 liters during this period!
- There's coconut water consumption in late December - I had this while skiing
- In early February, there are a few days with only water, smoothies, and some soda. This corresponds to when I had my wisdom teeth removed
- I have energy drinks on the same day as protein shakes. This matches reality - I have a pre-workout energy drink and protein shake on days that I lift
- I seldom have beer, but I have more beer than I have protein shakes
- I infrequently have wine and liquor. This is good!
- You can see wine consumption during the New Years period
- Most liquor consumption was during vacations
Dogs are awesome. Since March of 2014, I've owned a little dog named Riker:
I adopted her from the Humane Society in Milpitas. She was 8 weeks old. She recently had her fifth birthday. Happy birthday Riker! I love her very much.
Anyways, when I got her, I was curious about what type of dog she was. She looks like a chihuahua, but has some features that don't match the traditional chihuahua:
Curled, fluffy tail
Gradient-banded coat near her front legs
Sheds mountains of fur
Generally pleasant demeanor
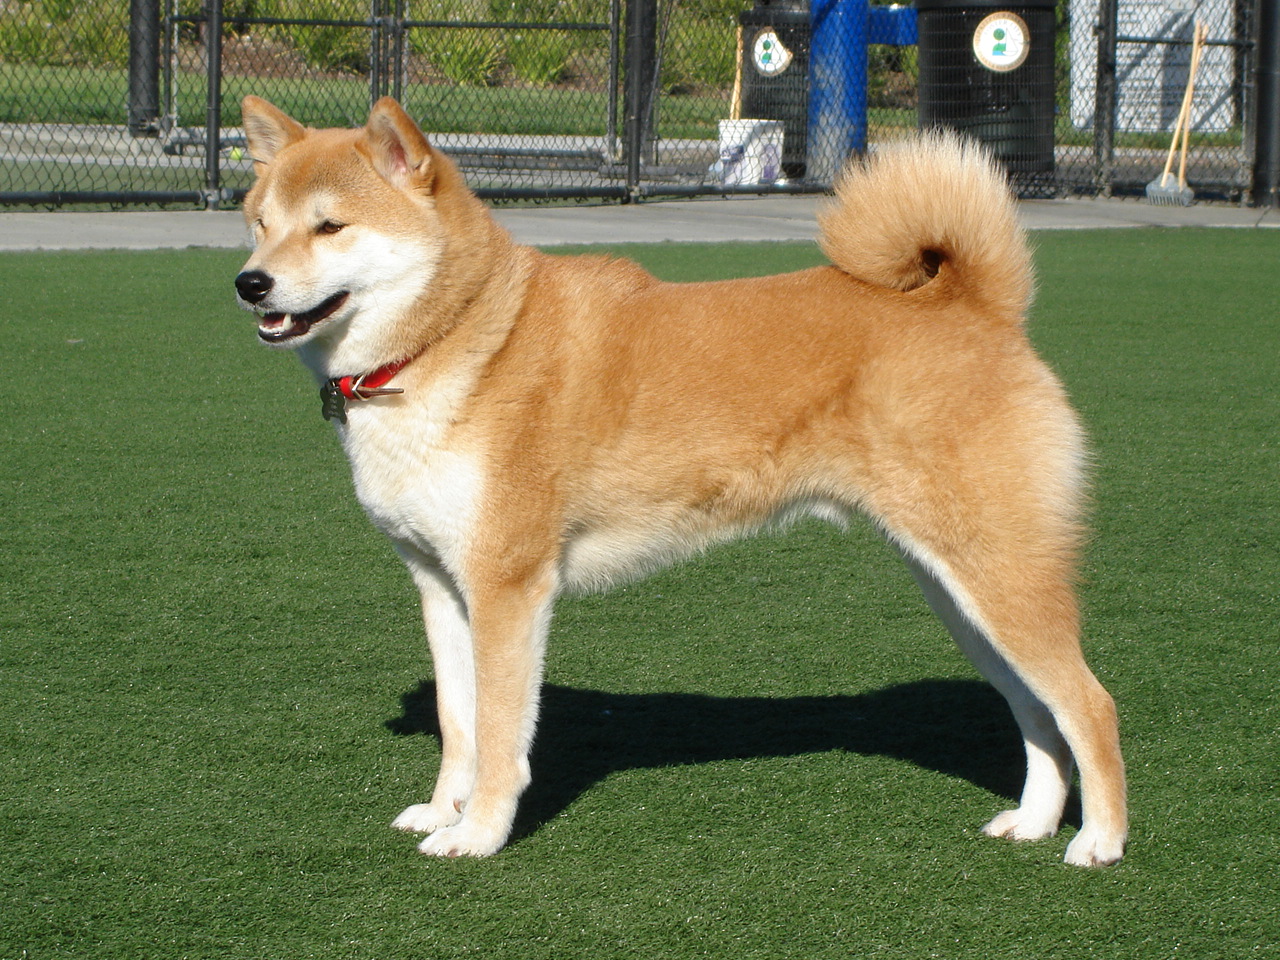
I thought she might have been part Shiba Inu. These dogs are adorable and have the curled tail and gradient-banded coat. Here's one from Wikipedia:
Doesn't this dog look like Riker? With the tail and banded coat? I thought so too.
Whenever other people asked me about Riker, I would tell them she's "part chihuahua, part shiba inu". They believed me, but I didn't have any proof.
Enter Embark
A good friend of mine told me about a service where you can get your dog's DNA analyzed. It's called EmbarkVet (disclaimer: this is a referral link). Embark gives your dog a breed report, health analysis, and some cool genetic information. It's like 23andMe for your dog.
I signed up for the service. A few days later they sent me a DNA swab kit. It's like an oversized q-tip. After sticking this in Riker's cheeks for 30 seconds or so (she wasn't happy about this, but I told her it was for science), I packed the kit in the return shipping and sent it off.
Over the next few weeks, Embark notified me as the analysis progressed. After 3 weeks or so, my pressing question was answered: they told me what type of dog she was!
Less than 50% chihuahua
To my absolute amazement, Riker is not even mostly chihuahua! The results confirm that Riker is a pomeranian! The full breakdown is:
50% Pomeranian (this accounts for the curved tail, banded coat, shedding, and how she's nice to be around)
10.6% "Supermutt" (small amounts of DNA from other dogs, including Cocker Spaniel)
I also learned that she has 1.5% "Wolfiness", which indicates ancient wolf genes that have survived through to modern domesticated dogs. Cool!
Note: I am not a trained biologist. Regrettably, I spent much of my college biology course playing Pokémon Crystal, although I do remember some parts of the genetics sections.
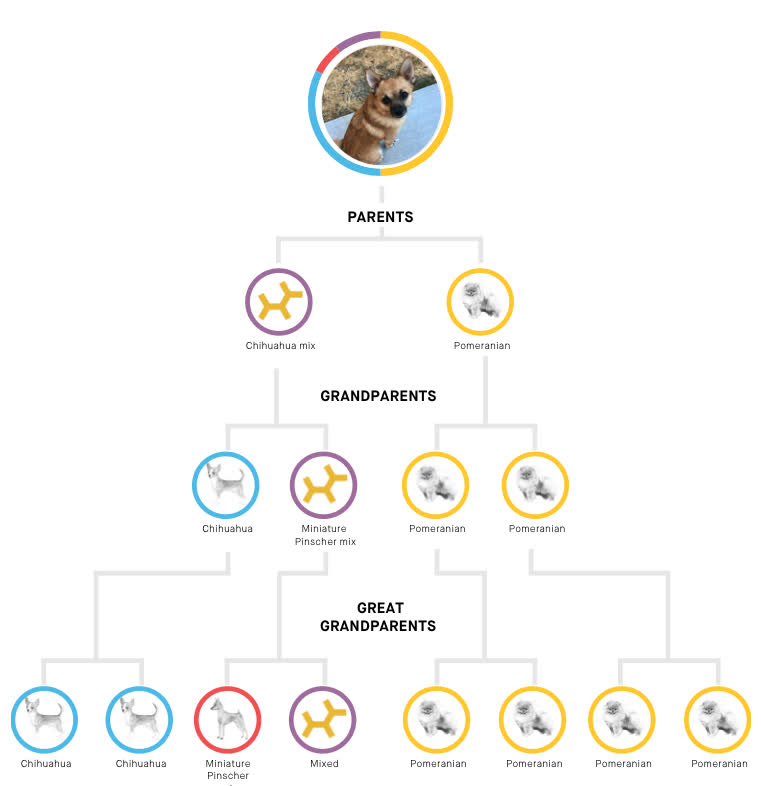
A family tree
Embark also determines haplotypes, which means they can tell what genes of Riker's came from which parents. This lets them generate a family tree:
This means Riker's parents were a chihuahua mix and a purebred pomeranian.
Analyzing my dog's DNA
Besides finally being able to see my dog's genetic history, I was super happy that I could download the raw genetic data. When I unzipped the file, I was left with two text files:
riker.tfam // 75B
riker.tped // 6.7MB
(I renamed them for brevity)
I searched for information on these file types. They both seem to be related to the free PLINK genetics software package.
If we download PLINK and run it on these files, we get:
$ plink --tfile riker
Processing .tped file... 77%
Error: Invalid chromosome code '27' on line 166046 of .tped file.
(This is disallowed for humans.  Check if the problem is with your data, or if
you forgot to define a different chromosome set with e.g. --chr-set.)
This is pretty cool! PLINK defaults to human DNA. This file is from a dog, not a person. Looking through the plink --help file, we can see that they have support for lots of species:
--cow/--dog/--horse/--mouse/--rice/--sheep : Shortcuts for those species.
(I wonder why rice is so interesting to the software...)
$ ls
plink.bed
plink.bim
plink.fam
plink.log
riker.tfam
riker.tped
These look to be PLINK metadata files that the software uses to do its processing.
We can use PLINK to do some interesting sounding genetic computations. For example, if we run it with the --homozyg flag, we can see homozygosity reports. According to Wikipedia (I must have been in Johto during this part of biology), zygosity is "the degree of similarity of the alleles for a trait in an organism". Running it produces:
$ plink --dog --tfile riker --homozyg
1 dog (0 males, 1 female) loaded from .fam.
--homozyg: Scan complete, found 27 ROH.
Results saved to plink.hom + plink.hom.indiv + plink.hom.summary .
The software knows that the dog is female, which is pretty cool. The files it generated seem to indicate the degree of homozygosity for her individual genes. Neat!
If we run with the --het flag, we can see inbreeding coefficients. The file it produces show this:
O(HOM)    Observed number of homozygotes
E(HOM)    Expected number of homozygotes
N(NM)     Number of non-missing genotypes
F         F inbreeding coefficient estimate
-1 looks like it indicates a sampling error or contamination according to the docs:
The estimate of F can sometimes be negative. Often this will just reflect random sampling error, but a result that is strongly negative (i.e. an individual has fewer homozygotes than one would expect by chance at the genome-wide level) can reflect other factors, e.g. sample contamination events perhaps.
We can also use the software to find what parts of the genotyping are missing with the --missing flag. From this, I was able to gather that Riker only has a missing SNP rate of 0.0009034 (less than 1%). I think this means that Riker's DNA in this sample is over 99% complete. Cool!
I may make Riker's DNA available online some day for others to do genetic analysis.
Anyways, I thought this was a fun exercise into how genetic data is stored and processed. It's really cool that there is open source software to analyze this data. Thanks for reading!
allows you to write using an easy-to-read, easy-to-write plain text format, then convert it to structurally valid XHTML (or HTML)
It's a common technique for writing blogs, as it lets the author write text in the text editor of their choice.
I write this page in vim, which is a command line text editor. I love vim for many reasons that are outside the scope of this post. I've been using it as my primary editor for almost 5 years. I wanted a good solution for writing Markdown in vim.
Because vim is a command line editor, it makes it tougher to use it to write rich text. In a GUI program, rich text can be rendered inline and as-you-edit. A command line tool can show you the formatting you have applied to text, but it does not give you an accurate rendering of how your content will look as you edit it.
I wanted to continue to use vim to edit my blog posts (I find vim plugins for other editors to be a worse approximation than "I can't believe it's not butter"). This post is about how I solved this problem.
A Markdown preview app
On macOS, you can get apps to render Markdown in a window. One that I like a lot is Marked, which automatically refreshes its preview when the Markdown file changes. This means you can open a .md file in Marked and get live updates as you change it. This can be used with any editor, including vim. The flow is something like:
touch or :e the file you want to write
Open Marked
Open the file in Marked
As you save to it with :w, the preview will be auto-refreshed. I like this, but wanted to open it with a single key combination.
Adding Marked to vim
We can write a vim function to help us with this. Something like this:
function OpenInMarked2()
    " Open the file in Marked here
endfunction
Running a shell command from vim
We can use ! to run a command from our function. Technically, this is the filter command. From :help !:
!{motion}{filter} Filter {motion} text lines through the external program {filter}.
You can try this in your vim. Just run :!pwd, and you should be presented with your shell and your current working directory. Below it, vim helpfully tells us "Press ENTER or type command to continue".
This is great! Using this and the macOS open command, we can at least launch Marked 2 with something like this:
!open -a Marked\ 2.app
But what about opening the current file? vim lets us use % from Ex commands as a stand-in for the path to the current file. So we can do something like:
!echo %
to see the current file. We can use this with open to open the current file in vim:
!open -a Marked\ 2.app %
This is the body of our OpenInMarked2 function:
function OpenInMarked2()
    !open -a Marked\ 2.app %
endfunction
Once we have this function, we can call it with the Ex call command, like this:
:call OpenInMarked2()
This will open the current file in Marked, but will leave us at the shell with "Press ENTER or type command to continue" there. We still have to press enter before we can edit the file live.
Defining a mapping
We can use a vim mapping to call the function for us. A mapping lets us take a key combination and map it to a command. For the key combination, I like to use <leader>, which is a user-controlled modifier in vim. This means that <leader> _ is wide open for use in your .vimrc. For my leader key, I use , (comma), as it's near the other modifiers on a US keyboard. For leader mappings, I like a mnemonic key combination, as it makes it easier to remember.
A good choice for this mapping, which is applicable for Markdown and for opening Marked, is <leader>m. Our mapping to call the function might look like this:
nmap <silent> <leader>m :call OpenInMarked2()
Here's a decoder ring for what these commands mean:
nmap means a mapping that exists in vim's normal mode
<silent> means the mapping will not be echoed on the command line
<leader>m is the mapping we've picked for this particular command
:call will call a particular function
OpenInMarked2() is the name of the function we'd like to call
If you add this mapping and function to your .vimrc, you'll see that it works kind of. You have to hit enter to get the command to actually run, and then after doing so you're left at the shell, so you need to hit enter again before returning to the editor.
Hitting enter twice
We can add a press of the enter key to our mapping using <CR>. This acts as though the user has pressed the carriage return. We'll add two of them, as we need one to run the function and another to return to the editor. Our mapping now looks like this:
I hope you found this post helpful. I have been using OpenInMarked2 to help me write Markdown for 2 years now, and I think it's a cool example of how to extend vim to fit your needs.
This is the first post on my new website! You're reading this on the brand newpeterhajas.com. Let's break it down.
A (not so new) domain
It's worth noting that this page is also hosted on peter.haj.as. I have had this domain from American Samoa for some time. I love the idea of domains that are people's names with no added alphanumeric characters, and this one fits the bill for me.
My own static site generator - what could possibly go wrong?
My old page was powered by Hyde. While this project provides a lot of flexibility, I felt that I was not using all of its features. I wanted something dead-simple that could enable me to write more. As a result, I wrote my own.
This site is still statically-generated from Markdown, but it's now done with a Bash script with only one dependency (a markdown binary). This makes it easier to set up on a new machine. It also lets me really understand how the site works.
The site generates quickly, and it's been a great learning opportunity! For example, I learned how to format dates using date (see here). I'm still learning (I don't know web layout very well, for example) but I think it's better to jump in with both feet when learning something new.
The site is missing some stuff (like RSS support), but I plan to iterate on it over time.
Hopefully I'll write more
All of this is for naught if I don't actually use the damn thing to write and think out loud.
I hadn't updated my old webpage in over 6 years. There's so much that has happened in that time that I want to write about, like:
 Shop by the Sea
 Skyscraper By a Lab
 Mountain Route
 The Super Nintendo Room


 (
( (
(
